Bullish channel has formed
Participation Rate, Employment Change and Unemployment Rate were published in New Zealand. The US will release Composite PMI and ISM Non-Manf. On the chart, the price is growing through an ascending channel. As it looks the price is going to be almost steady in the next few days.
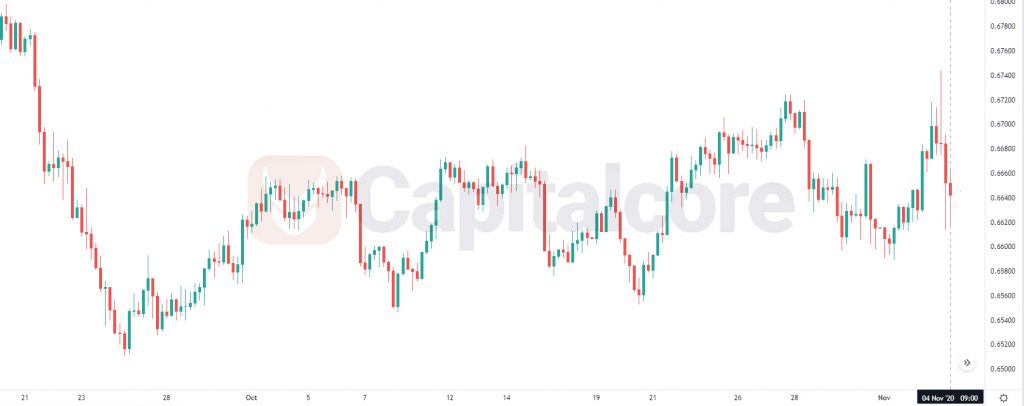
Chart Notes:
• Chart time-zone is UTC (+03:00)
• Candles’ time-frame is 4h.
The support rests at 0.66130 with resistance at 0.66910 which the weekly pivot point at 0.66450 is located in between the lines. The EMA of 10 is moving with bearish bias in the ascendant channel and it is located above the EMA of 200 and the EMA of 100. The RSI is rising towards level 50, the MACD line is above the signal line in the positive territory and the Stochastic is moving in low ranges. The ADX is showing weak buy signal. The price is below the Ichimoku Cloud and above the Chinkou Span. The Tenkan-sen and the Kijun-sen are both showing a horizontal trend.
NZDUSD will be fluctuating within the support and resistance lines.
• DISCLAIMER: Please note that the above analysis is not an investment suggestion by “Capitalcore Ltd”. This post has been published only for educational purposes.