Head and shoulder pattern is formed
Building Permits and ANZ Business Confidence were released in New Zealand and the US will publish Unemployment Claims and Continuing Claims. On the chart, the price has had a sharp ascend and formed head and shoulder pattern was formed. The overall look of the chart is bearish.
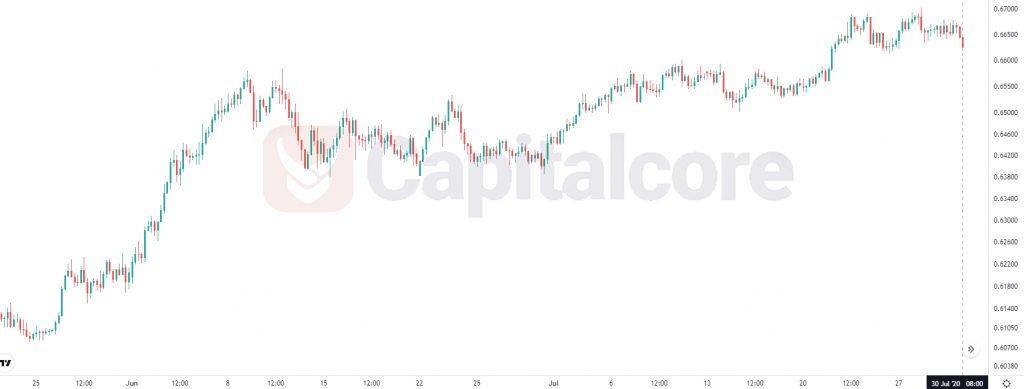
Chart Notes:
• Chart time-zone is UTC (+03:00)
• Candles’ time-frame is 4h.
The support rests at 0.66130 with resistance at 0.66750 which the weekly pivot point at 0.66240 is located in between the lines. The EMA of 10 is moving with bearish bias in the ascendant channel and it is located above the EMA of 200 and the EMA of 100. The RSI is falling below level 50, the MACD line is below the signal line in the negative territory and the Stochastic is moving in low ranges. The ADX is showing sell signal. The price is in the Ichimoku Cloud and below the Chinkou Span. The Tenkan-sen is showing a downward trend and the Kijun-sen is showing a horizontal trend.
Short positions are recommended towards 0.66000.
• DISCLAIMER: Please note that the above analysis is not an investment suggestion by “Capitalcore Ltd”. This post has been published only for educational purposes.