Trend reversal is potential on the chart
AUD/NZD started an ascending trend on 22nd of November 2021; this bullish wave could pump the price up to almost 8.3% until 8th of June 2022, when the price line reached out to a strong resistance zone and could not break above it. The price line is now approaching the resistance level once more and is potential of going through a trend reversal.
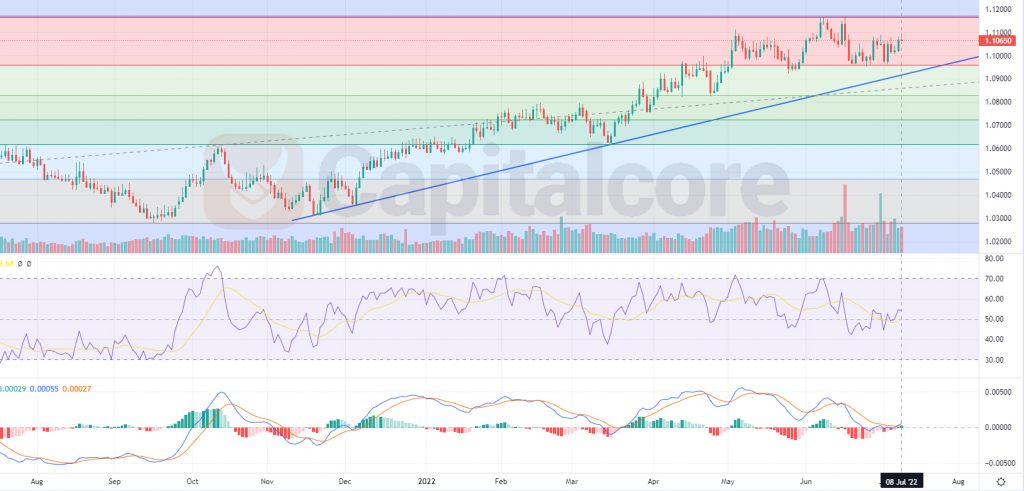
Chart Notes:
• Chart time-zone is UTC (+03:00)
• Candles’ time-frame is daily.
The price line on AUD/NZD price chart is indicating 1.1065 at the moment. The area is located in the middle of the sideway channel which has currently formed on the chart. The channel is indicated as a horizontal zone, highlighted as light red. The ascending blue line on the chart indicates the trend line, which has supported the ascending trend so far. RSI is indicating almost 53 and MACD is showing bullish wave on going. Traders can be waiting for the price line to break below either the trend line or the red zone, and then they can enter short positions on the retest. The target for the bearish wave could be considered on 1.08323 and 1.06455 .
• DISCLAIMER: Please note that the above analysis is not an investment suggestion by “Capitalcore Ltd”. This post has been published only for educational purposes.