Is this the start of a big ascend or a strong descend?!
Building Permits was released in New Zealand and the US will publish Consumer Confidence and House Price Index. for this reason the market was the subject of some major changes, as the price chart of NZD/CAD indicates from this point, the price is gonna make some important decision.
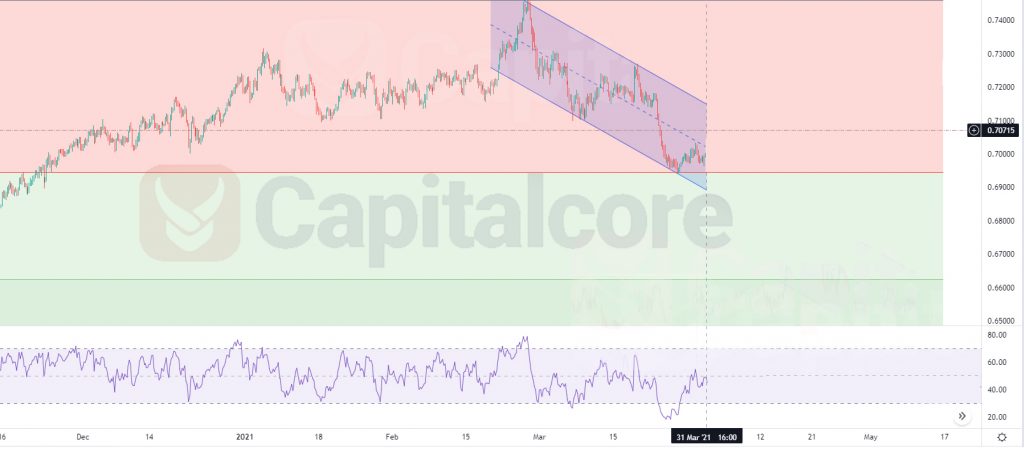
Chart Notes:
• Chart time-zone is UTC (+03:00)
• Candles’ time-frame is 4h.
The support rests at 0.69710 with resistance at 0.70730 which the weekly pivot point at 0.70420 is located in between the lines. The EMA of 10 is moving with bullish bias in the descendant channel and it is below the EMA of 200 and the EMA of 100. The RSI is moving on level 50, the MACD line is above the signal line in the positive territory and the Stochastic is moving in high ranges. The ADX is showing buy signal. The price is in the Ichimoku Cloud and above the Chinkou Span. The Tenkan-sen and the Kijun-sen are both showing a horizontal trend.
NZDUSD found strong support around 0.695 area and it seems that the pair is trying to recover from the last decline. While considering pullbacks, buyers can expect 0.70800.
• DISCLAIMER: Please note that the above analysis is not an investment suggestion by “Capitalcore Ltd”. This post has been published only for educational purposes.