Uptrend has just began
Visitor Arrivals data has been released in New Zealand and the US will publish PPI and PPI Core data. As the chart shows, NZD could smoothly recover the lost against USD and started an uptrend. the uptrend does not seem to be finishing.
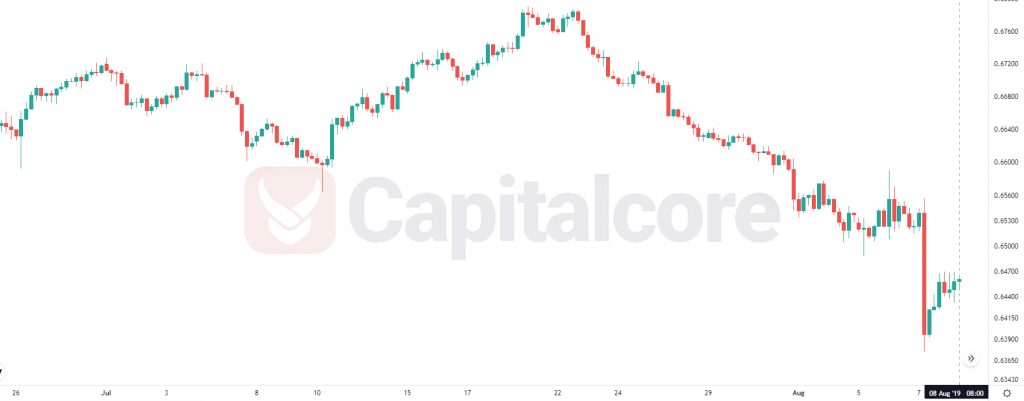
Chart Notes:
• Chart time-zone is UTC (+03:00)
• Candles’ time-frame is 4h.
The support rests at 0.64600 with resistance at 0.65170 which both lines are below the weekly pivot point at 0.65610. The EMA of 10 is moving with bullish bias in the descendant channel and it is below the EMA of 200 and the EMA of 100. The RSI is moving on 50 level, the MACD line is above the signal line in the positive territory and the Stochastic is moving in high ranges. The ADX is showing buy signal. The price is in the Ichimoku Cloud and below the Chinkou Span. The Tenkan-sen is showing an upward trend while the Kijun-sen is showing a horizontal trend.
Long positions are recommended towards 0.65700.
• DISCLAIMER: Please note that the above analysis is not an investment suggestion by “Capitalcore Ltd”. This post has been published only for educational purposes.