The descending trend line is broken
NZD/JPY has been moving within a descending dynamic resistance since 21st of October 2021 and despite several attempts, could not break above it, until 29th of December. The price line then had a retest of the broken resistance and then continued its ascending trend.
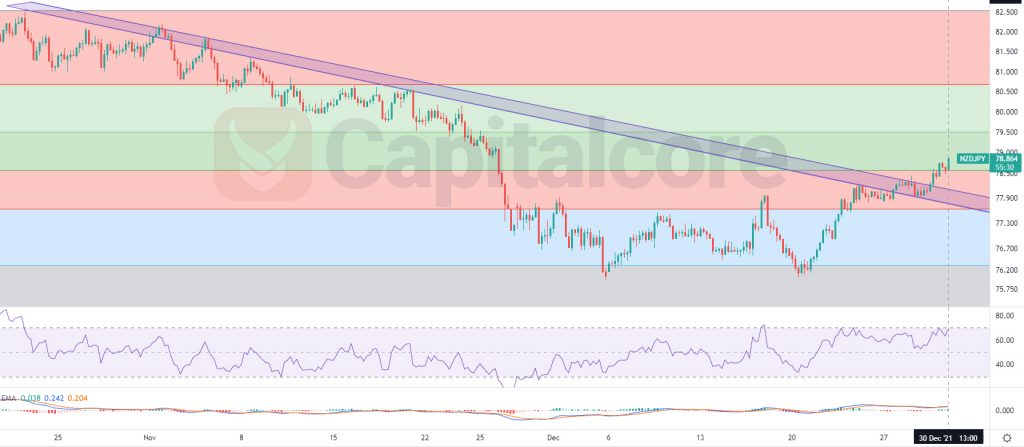
Chart Notes:
• Chart time-zone is UTC (+03:00)
• Candles’ time-frame is 4h.
The price at the moment is 78.854. Both the dynamic resistance, shown as blue area on the chart, and level 0.5 of the Fibonacci retracement, which would be around 78.581 has been broken. RSI is showing almost 70 and has issued several divergence comparing to the price line. MACD is showing weak ascending wave and a temporary ascending leg is potential, but not tradable. In case the price entered descending phase and could descend to level 0.618 of the Fibonacci retracement, which would be somewhere around 77.65, then buyers can enter the market and target 78.76, 79.525 and 80.5 as their targets.
• DISCLAIMER: Please note that the above analysis is not an investment suggestion by “Capitalcore Ltd”. This post has been published only for educational purposes.