Future outlook and key indicators
The NZDJPY currency pair has recently undergone a bullish wave, but is now approaching a resistance level. The RSI indicator is showing overbuying, and the candle patterns suggest a potential for a bearish wave.
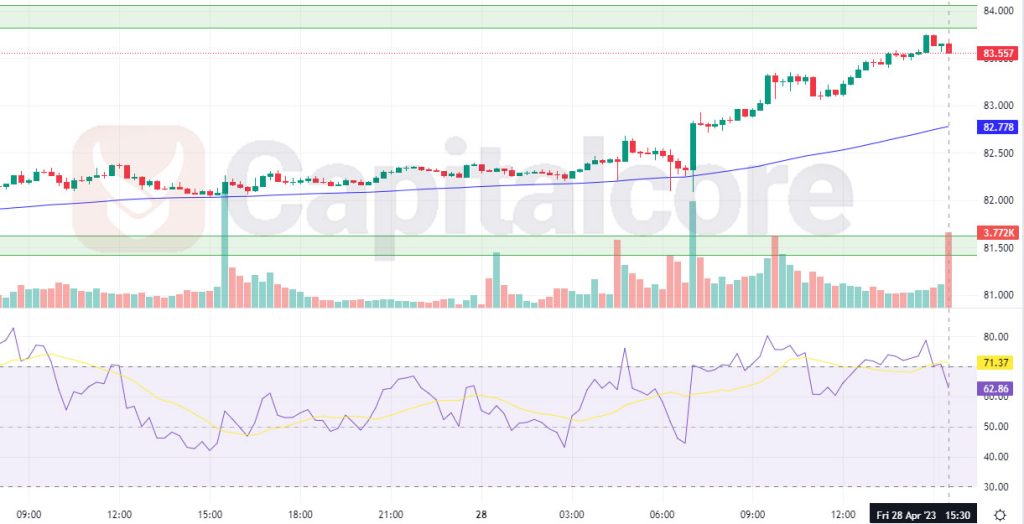
Chart Notes:
• Chart time-zone is UTC (+03:00)
• Candles’ time-frame is 4h.
Looking at the price chart, we can see that the NZDJPY pair has been in an uptrend, as indicated by the higher highs and higher lows. However, the price is now approaching a resistance level, which has held in the past. This could suggest that the upward momentum is slowing down, and a reversal may be in the cards.
The RSI indicator is currently showing overbuying, which suggests that the price has been pushed too far too fast and may be due for a pullback. This is a warning sign for traders, as it indicates that the market may be overextended and due for a correction. Finally, looking at the candlestick patterns, we can see that there are signs of a potential bearish wave. Specifically, the most recent candlestick pattern may be indicating a potential reversal, such as a shooting star or a bearish engulfing pattern. If the price fails to break through the resistance level and begins to move downwards, this could confirm the bearish signal. Overall, the current situation for NZDJPY suggests that traders may want to be cautious in their approach. While the recent bullish wave has been strong, the resistance level, RSI indicator, and candlestick patterns are all pointing to a potential bearish reversal. Traders may want to wait for more confirmation before making any decisions, such as a confirmed break below the support level, to avoid getting caught on the wrong side of a potential trend reversal.
• DISCLAIMER: Please note that the above analysis is not an investment suggestion by “Capitalcore Ltd”. This post has been published only for educational purposes.