- Posted By: capadmin
- Category: Market News
The Kiwi’s Flight Against the Yen: A Technical Analysis
The NZDJPY currency pair, representing the exchange rate between the New Zealand Dollar and the Japanese Yen, serves as a significant indicator of Asian-Pacific economic health. This cross-pair offers insights into the interplay between commodity-driven economies and safe-haven currencies.

Chart Notes:
• Chart time-zone is UTC (+03:00)
• Candles’ time-frame is 4h.
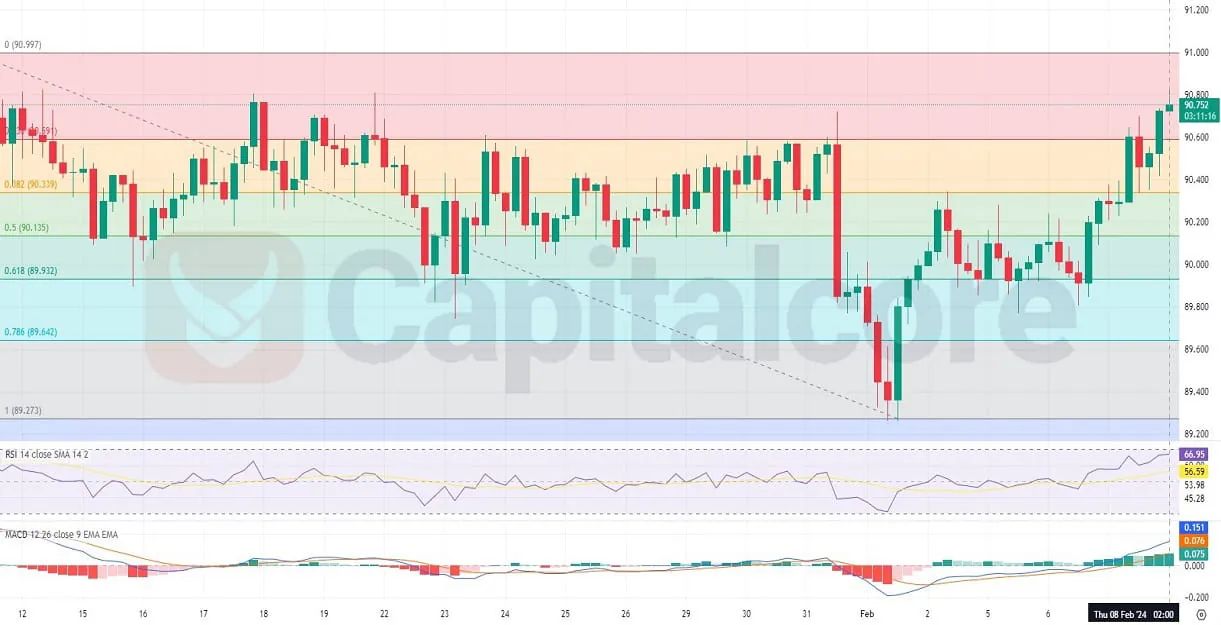
Examining the H4 chart for the NZDJPY pair, we observe a positive trend as the price action has recently broken above a consolidation phase. The candles are currently positioned above the 61.8% Fibonacci retracement level, suggesting a potential continuation of the uptrend. The MACD histogram showcases increasing bullish momentum as it transitions from below to above the signal line, supporting the upside movement. RSI is ascending towards the 70 level, indicating growing buying pressure without yet signaling overextended conditions. The pair’s recent price surge past the consolidation suggests an accumulation phase, preparing for another leg up. Traders should monitor the RSI for any signs of divergence that may signal an impending change in trend strength or direction.
• DISCLAIMER: Please note that the above analysis is not an investment suggestion by “Capitalcore Ltd”. This post has been published only for educational purposes.