NZD/USD Forecast with Retail Sales Data Impact
The NZDUSD, commonly known as the “Kiwi”, is a major forex pair influenced by economic policies, commodity prices, and risk sentiment. It often reflects global trade dynamics, given New Zealand’s strong ties to commodity exports and the USD’s role as the world’s reserve currency. Today, the NZDUSD pair faces key fundamental drivers as the U.S. Retail Sales Ex Autos, Advance Retail Sales, Import Price Index, Capacity Utilization Rate, and Industrial Production reports are set to be released. A higher-than-expected retail sales figure would indicate strong consumer spending, boosting the USD and adding downside pressure on NZD/USD. Conversely, New Zealand’s Performance of Manufacturing Index (PMI) and Food Price Index (FPI) could provide some relief if they signal economic resilience. However, with recent USD strength supported by economic stability and inflation concerns, the Kiwi remains vulnerable to further declines unless U.S. data disappoints or the Fed signals a dovish shift.
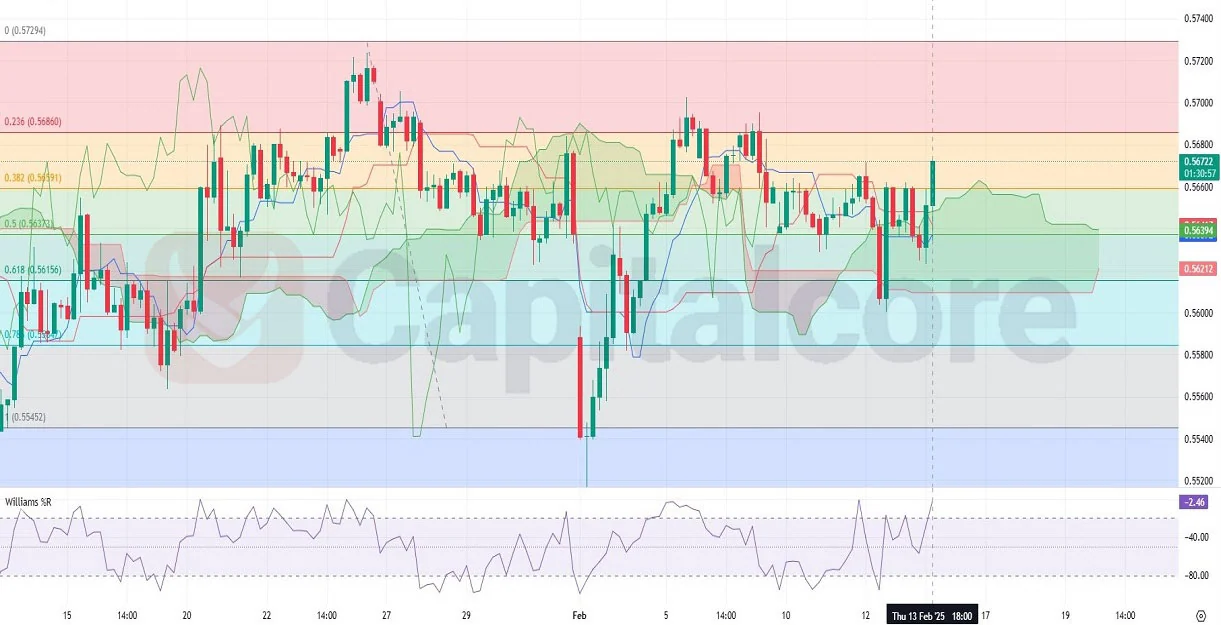
Chart Notes:
• Chart time-zone is UTC (+02:00)
• Candles’ time-frame is 4h.
NZDUSD is currently at its lowest price since October 2022, undergoing a correction phase with bullish candles pushing above the Ichimoku cloud. The 0.236 Fibonacci level is the first key resistance zone, and a breakout could open the path toward the 0.5 Fibonacci retracement. However, the Ichimoku cloud has thinned, indicating potential weakness in the bullish move. Williams %R is near oversold conditions, suggesting a possible rebound, but confirmation is needed. If the NZD USD price fails to sustain above the cloud, a breakdown below 0.5615 (61.8% Fibonacci retracement) could lead to further downside pressure, reinforcing the bearish trend.
• DISCLAIMER: Please note that the above analysis is not an investment suggestion by “Capitalcore LLC”. This post has been published only for educational purposes.