- September 3, 2024
- Posted By: james w
- Category: Market News
Kiwi Faces Pressure: NZDUSD H4 Technical Analysis
The NZDUSD, commonly referred to as the “Kiwi,” is a major forex pair consisting of the New Zealand Dollar (NZD) and the United States Dollar (USD). As a commodity currency pair, NZD/USD is influenced by global economic trends, commodity prices, and interest rate differentials. The pair is popular among traders for its liquidity and the potential for high volatility, often responding sharply to economic data and geopolitical developments.
Today’s key economic events could significantly impact the NZDUSD pair, particularly any updates related to New Zealand’s trade balance, which plays a critical role in the currency’s valuation. Positive data from New Zealand could strengthen the Kiwi, while any negative sentiment from the US market could drive the NZD USD forex pair lower. Additionally, any changes in the Federal Reserve’s stance on interest rates could also lead to volatility, as traders assess the future path of monetary policy in the US. Market participants will closely monitor these developments, which could set the tone for short-term price movements in the NZDUSD forex pair.

Chart Notes:
• Chart time-zone is UTC (+03:00)
• Candles’ time-frame is 4h.
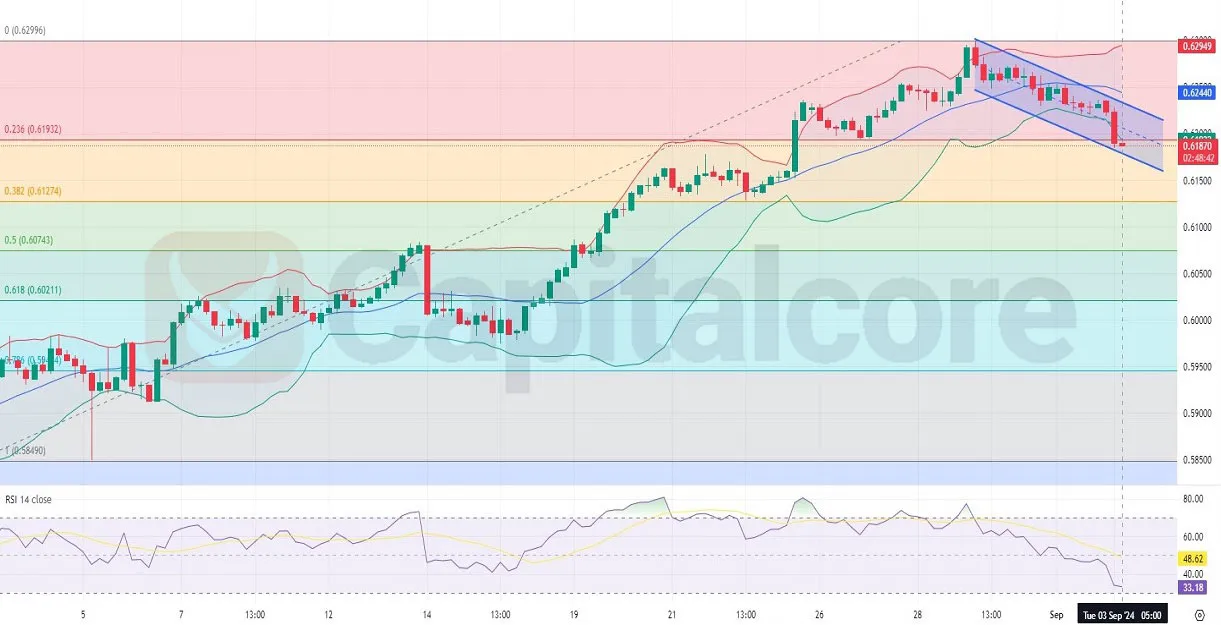
The H4 chart of NZDUSD displays a clear bearish trend, with 13 out of the last 19 candles being bearish, including the most recent one. The price has moved from the upper Bollinger Band towards the middle band and then to the lower band, where it is currently hovering, indicating strong selling pressure. The expansion of the Bollinger Bands suggests increasing volatility, supporting the downward movement. The price has recently broken below the 0.236 Fibonacci retracement level and is now between the 0.382 Fibonacci level, highlighting a significant retracement from its recent highs. The RSI indicator is trending below 50 and approaching oversold territory, currently around 33.18, suggesting that while the bearish momentum is strong, there might be a potential for a short-term correction or consolidation before continuing its downward trajectory.
• DISCLAIMER: Please note that the above analysis is not an investment suggestion by “Capitalcore LLC”. This post has been published only for educational purposes.