- August 16, 2024
- Posted By: james w
- Category: Market News
Kiwi Under Pressure: Key Levels to Watch
The NZD/USD, often referred to as the “Kiwi,” represents the currency pair of the New Zealand Dollar against the US Dollar. The Kiwi is known for its correlation with commodities, especially dairy products, and is influenced by interest rate differentials between the Reserve Bank of New Zealand (RBNZ) and the Federal Reserve (Fed). With upcoming significant economic data from both New Zealand and the US, including the US Treasury International Capital (TIC) report, US residential building permits, and speeches from central bank officials, the NZD/USD pair may experience heightened volatility. Traders should particularly focus on the RBNZ Governor Adrian Orr’s speech and the US economic indicators, as better-than-expected data from the US could strengthen the US Dollar, pressuring the NZD/USD lower. Conversely, any hints of future monetary policy shifts from the RBNZ could support the Kiwi, making the pair more attractive.

Chart Notes:
• Chart time-zone is UTC (+03:00)
• Candles’ time-frame is 4h.
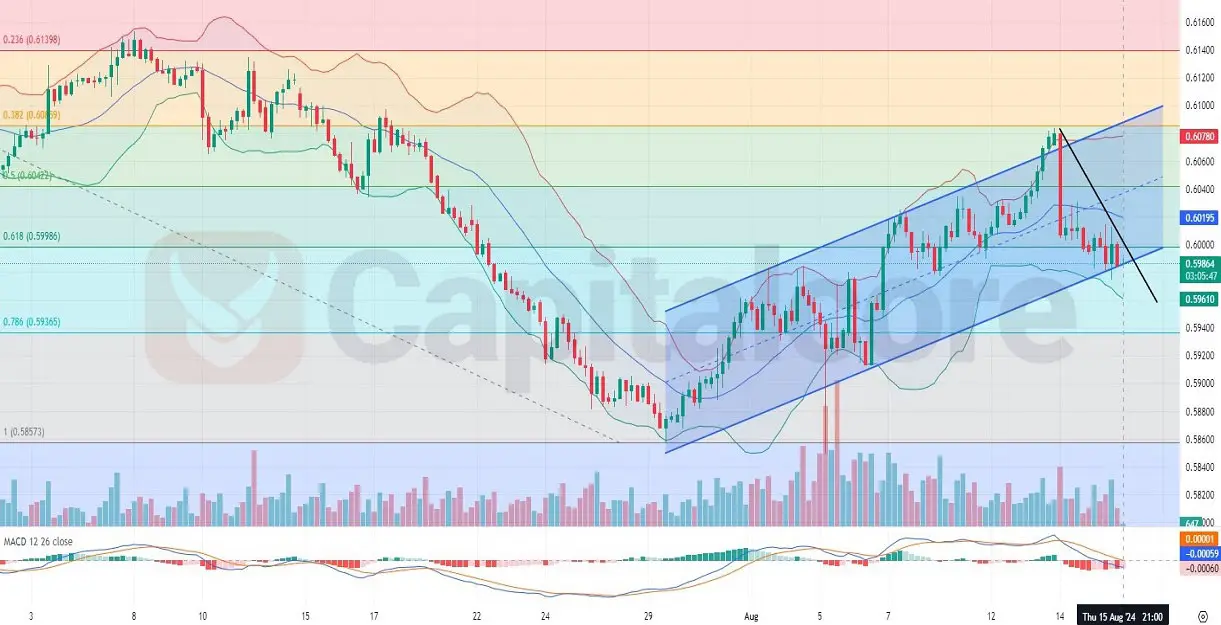
Analyzing the NZD/USD H4 chart, it’s clear that after a bullish trend over the past two weeks, the pair is currently struggling to maintain its upward momentum. The price is moving along the lower line of the Bollinger Bands, indicating potential bearish pressure, especially as the last 10 candles have shown a predominant bearish trend with 7 out of 10 being bearish. The price has retraced from the upper band down to the middle band and is now hovering between the lower and middle bands, with the Bollinger Bands widening slightly—a sign of increasing volatility. The MACD and histogram are also signaling bearish momentum, supported by the higher volume of red candles. Additionally, the price is trading between the 0.786 and 0.618 Fibonacci retracement levels, suggesting a potential break below these levels could signal further downside. Traders should watch for a clear break below the lower Bollinger Band, which could indicate a continuation of the bearish trend.
DISCLAIMER: Please note that the above analysis is not an investment suggestion by “Capitalcore LLC”. This post has been published only for educational purposes.