Decoding NZDUSD SMA Crossover
In this analysis, we’ll delve into the NZDUSD currency pair to gauge its current market sentiment. We’ll observe the crossover between the shorter and longer Simple Moving Averages (SMA) to assess potential trends. Additionally, we’ll analyze the MACD and Signal line’s proximity, along with the histogram’s momentum, to identify any emerging opportunities or mixed signals in the NZDUSD trading landscape.
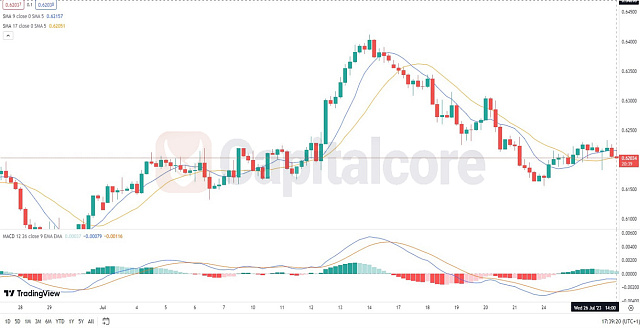
Chart Notes:
• Chart time-zone is UTC (+03:00)
• Candles’ time-frame is 4h.
In the NZDUSD analysis, we observe a bearish signal as the shorter Simple Moving Average (SMA) crosses below the longer SMA, potentially signaling a downtrend. However, this crossover hasn’t occurred sharply or suddenly, indicating a gradual shift in market sentiment. Additionally, the MACD and Signal line have been moving in close proximity, suggesting a lack of strong momentum. The histogram further confirms this, showing limited momentum. Traders should exercise caution as the market exhibits mixed signals. Waiting for clearer trends or additional confirmation may be prudent before making trading decisions on NZDUSD.
• DISCLAIMER: Please note that the above analysis is not an investment suggestion by “Capitalcore Ltd”. This post has been published only for educational purposes.