ETH's Resistance Breakout and Retest
Based on the market information, it seems that ETH was experiencing a bullish phase, which is characterized by an uptrend in prices. Additionally, the price line broke above a strong resistance zone, indicating that there was strong buying pressure and demand for ETH at that level.
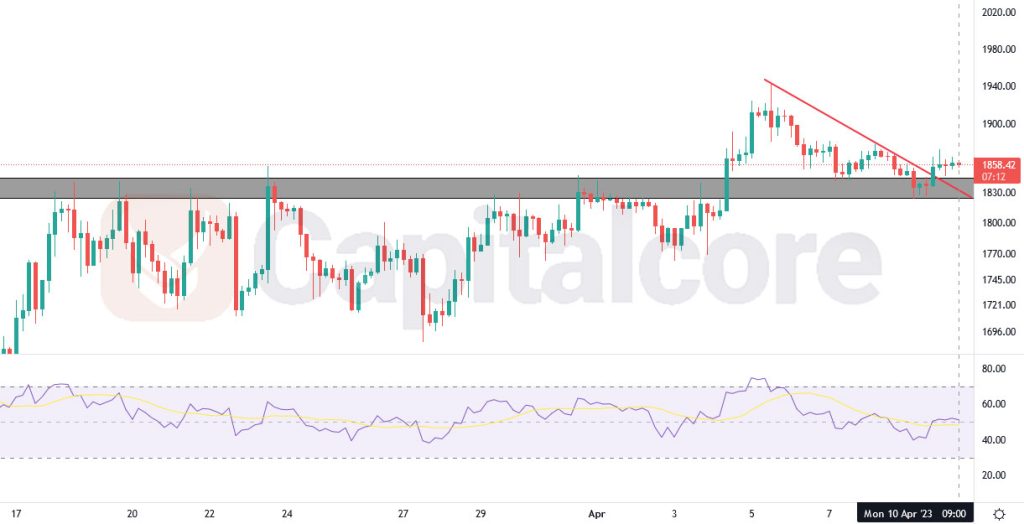
Chart Notes:
• Chart time-zone is UTC (+03:00)
• Candles’ time-frame is 4h.
However, it is important to note that after breaking above the resistance zone, there was a retest of that zone in the form of a bearish leg. This can be seen as a normal market behavior where price retraces back to previous resistance level, now turned support, before continuing its upward movement. Furthermore, the price line breaking above its last bearish trend line can be seen as a positive signal for ETH’s future price movement. It suggests that the bears have lost control of the market, and there is potential for a strong bullish phase, characterized by a sustained uptrend in prices. However, it is important to remember that cryptocurrency markets are highly volatile and subject to sudden price swings. Thus, traders and investors should exercise caution when trading and should always have a risk management plan in place. Additionally, other factors such as market sentiment, adoption rate, and regulatory developments can also impact the price of ETH in both positive and negative ways.
• DISCLAIMER: Please note that the above analysis is not an investment suggestion by “Capitalcore Ltd”. This post has been published only for educational purposes.