- May 4, 2023
- Category: Market News
RSI negative divergence in USDNOK
The USDNOK currency pair has been experiencing an ascending wave in its price line recently, but it appears to have formed a double top pattern. A double top is a bearish reversal pattern that forms after a sustained uptrend. This pattern occurs when the price reaches a high point twice and fails to break through it, indicating a potential shift in the trend. In this case, the double top is formed after the recent ascending wave, suggesting that the bullish momentum may be weakening.
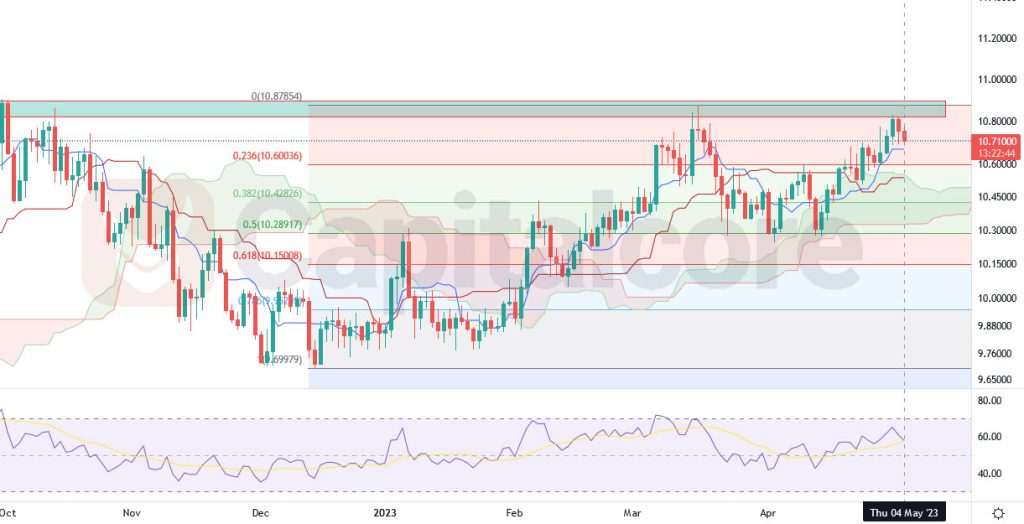
Chart Notes:
• Chart time-zone is UTC (+03:00)
• Candles’ time-frame is 4h.
The Relative Strength Index (RSI) is showing negative divergence, which means that even though the price is making higher highs, the RSI is not following suit, indicating that the buying pressure may be losing strength. This negative divergence reinforces the potential bearish wave, suggesting that a shift in trend from bullish to bearish may occur soon. If a bearish wave does occur, sellers may set their targets on different Fibonacci levels of the current ascending wave. Fibonacci levels are a series of horizontal lines that indicate areas of support and resistance based on the Fibonacci sequence. Traders often use these levels as potential areas to enter or exit trades. The Fibonacci levels in this case would be determined by drawing the Fibonacci retracement tool from the bottom of the ascending wave to the top of the double top pattern. The most common Fibonacci levels that traders use are the 38.2%, 50%, and 61.8% levels. These levels can be used as potential targets for sellers who are looking to profit from a bearish wave.
• DISCLAIMER: Please note that the above analysis is not an investment suggestion by “Capitalcore Ltd”. This post has been published only for educational purposes.