Market Indecision and Bearish Potential
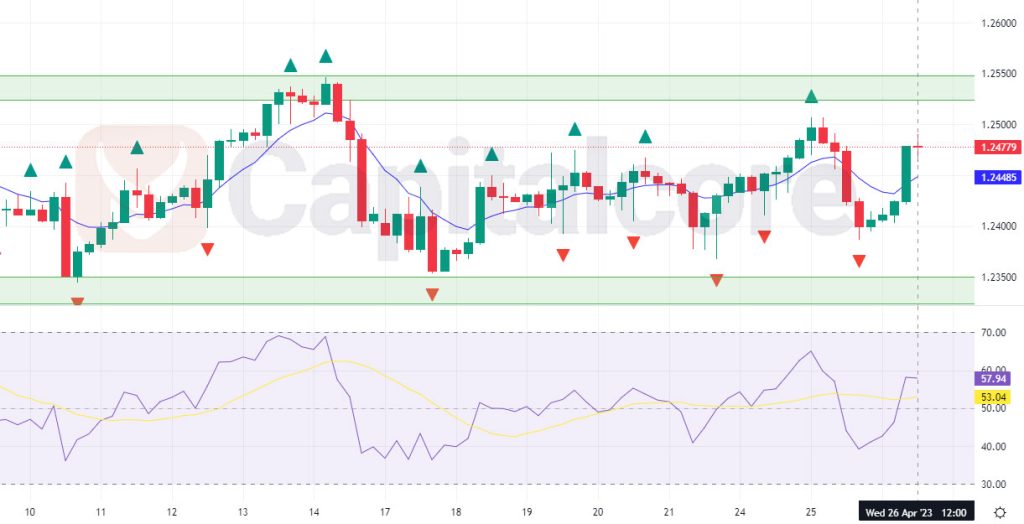
Chart Notes:
• Chart time-zone is UTC (+03:00)
• Candles’ time-frame is 4h.
Candle patterns are showing potential for a bearish wave. The formation of a William fractal above the previous candle after the current candle closes could signal a bearish leg in the near future. This could indicate that the bears are taking control of the market, and that prices could potentially move lower. Overall, the current situation in GBPUSD is characterized by indecision and a lack of clear direction. However, the bearish candle patterns and the potential formation of a William fractal suggest that a downward move could be in the cards. As always, traders should exercise caution and carefully consider their risk management strategies when trading in this market.
• DISCLAIMER: Please note that the above analysis is not an investment suggestion by “Capitalcore Ltd”. This post has been published only for educational purposes.