- September 18, 2023
- Posted By: capadmin
- Category: Market News
Is Silver Gearing Up for a Bullish Ride?
Silver, a key precious metal, has recently shown intriguing movements, prompting investors and traders to reassess their strategies. Analyzing its technical indicators provides insights into the potential direction of the market. Let’s delve into a detailed examination of the recent patterns and indicators to forecast the short-term trajectory of Silver.

Chart Notes:
• Chart time-zone is UTC (+03:00)
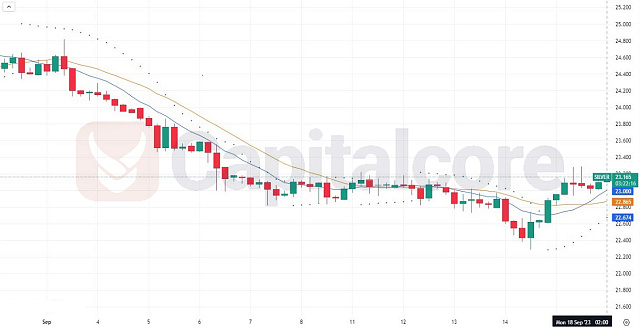
• Candles’ time-frame is 4h.
On the 4-hour chart for Silver, the crossover of the short-term SMA above the long-term SMA indicates an emerging bullish trend. This positive sentiment is reinforced by the Parabolic SAR displaying dots beneath the candles, suggesting a potential uptrend. Additionally, the RSI crossing above its MA line and a reading of 58.56 shows momentum leaning towards the bullish side, though it’s still below overbought levels. However, the discrepancy between the RSI and its MA, with the latter at 45.58, implies that this momentum is a recent shift. In summary, Silver appears to be gaining bullish momentum in the 4H timeframe, but traders should monitor for further confirmatory signals before making decisions.
• DISCLAIMER: Please note that the above analysis is not an investment suggestion by “Capitalcore Ltd”. This post has been published only for educational purposes.