- December 8, 2023
- Posted By: capadmin
- Category: Market News
EURGBP’s Consolidation Phase Analysis
The EURGBP pair, representing the exchange rate between the Euro and the British Pound, is a popular instrument for traders due to the economic significance of both currencies. Technical analysis provides insights into the market sentiment and potential price movements based on historical data.

Chart Notes:
• Chart time-zone is UTC (+03:00)
• Candles’ time-frame is 4h.
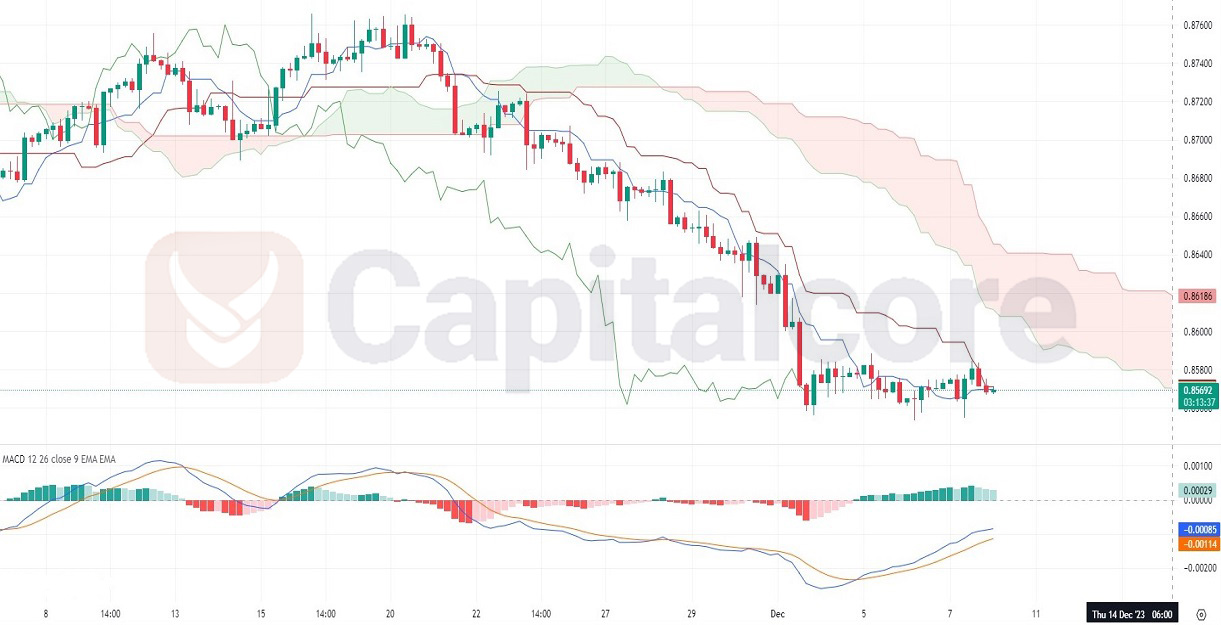
The EURGBP chart on the selected timeframe shows a pronounced downtrend, as indicated by the Ichimoku Cloud with price action consistently below the cloud, suggesting strong bearish momentum. The Conversion Line (blue) is below the Base Line (red), reinforcing the downtrend signal. Furthermore, the widening cloud anticipates a potential continuation of the current trend. The MACD indicator is below the signal line and hovering around the zero line, which reflects a lack of strong momentum and a consolidation phase. The histogram shows a minor bullish divergence with slightly increasing bars, yet this divergence is not substantial enough to contradict the overall bearish sentiment indicated by the Ichimoku Cloud.
• DISCLAIMER: Please note that the above analysis is not an investment suggestion by “Capitalcore Ltd”. This post has been published only for educational purposes.