the price line, below the resistance level
Silver price started ranging in a sideway market on March 8th 2022, after forming a climax on the chart. While the price line was on sideway market, a support and a resistance level were formed on the chart. Right now the price line is approaching the resistance level once more and some bearish signals have been issued.
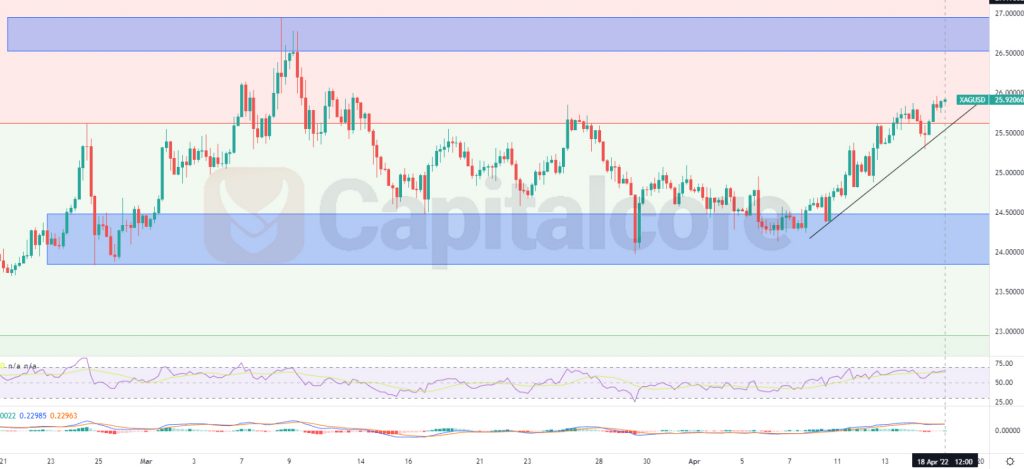
Chart Notes:
• Chart time-zone is UTC (+03:00)
• Candles’ time-frame is 4h.
The price line at the moment is on 25.9206 which would be below the resistance level. The resistance level is indicated as a blue zone above the price line on the chart, at 26.52 to 26.96. The black line shows the trend line which has formed the current ascending wave. RSI is almost on 65 and has also issued negative divergence signal. traders can be waiting for the price line to break below the resistance zone, then on the retest of this level, they can enter short positions heading to the support level at 24.48 to 23.84. As the target level includes a big range, traders may want to set several stops and targets.
Please note that this theory would not be of any value if the price line breaks above the resistance zone, before breaking below the trend line.
• DISCLAIMER: Please note that the above analysis is not an investment suggestion by “Capitalcore Ltd”. This post has been published only for educational purposes.