Descending trend line is broken
As Ukraine conflict is getting more serious and complicated, people are showing more tendency towards safe assets such as valuable metals and US stocks. Silver is also undergoing significant price changes due to the conflict. Technically, silver has broken above the descending trend line and is issuing buy signals.
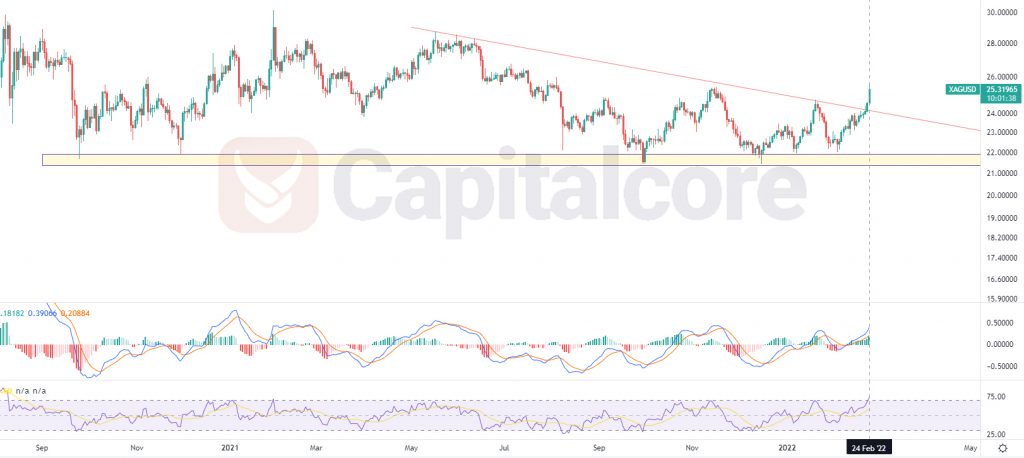
Chart Notes:
• Chart time-zone is UTC (+03:00)
• Candles’ time-frame is daily.
On the Silver price chart, The price is on 25.32 which would be just above the broken trend line. The red line above the price line indicates this trend line; as you can see on the chart, this line had been able to dump the price several times in the past, but finally on 23rd of February 2022, The price line could break above this level. RSI is on 72 and MACD is showing strong bullish wave on going. Traders can be waiting for a correction phase and then they can open long positions on the pullback. possible targets for the bullish wave could be considered on 30.02 and 32.77 . Please consider that in case the price line breaks below the yellow zone on the chart, the chance of a bullish wave would reduce.
• DISCLAIMER: Please note that the above analysis is not an investment suggestion by “Capitalcore Ltd”. This post has been published only for educational purposes.