- June 3, 2022
- Category: Market News
Bullish market on silver price chart
Silver price started a sharp descending wave on 18th of April 2022 and the price line descended about 22% until 13th of May 2022, when the price line reached out to a dynamic support line. The descending slope of the chart then decreased and now silver price is potential of forming a bullish wave.
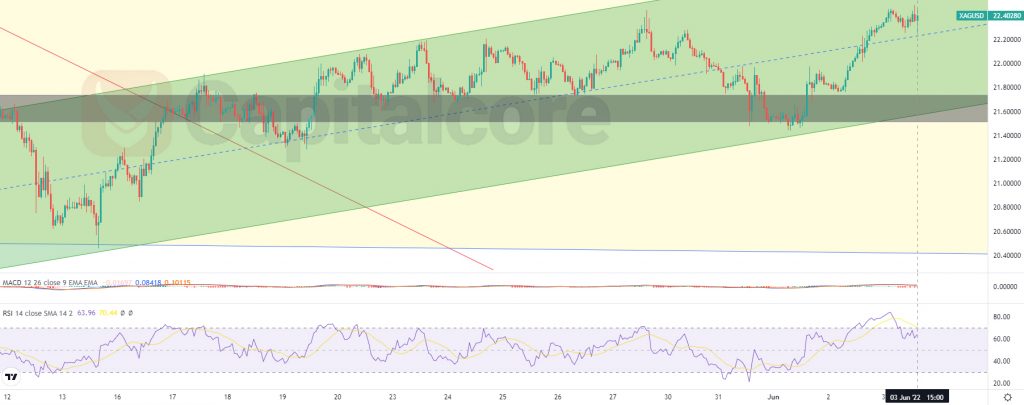
Chart Notes:
• Chart time-zone is UTC (+03:00)
• Candles’ time-frame is 1h.
The green zone on the chart indicates a bullish channel which has recently been formed on silver price chart. The price line is currently showing 22.4028, which would be just above the midline of the ascending channel. The gray zone on the chart indicates a static support level. RSI has issued negative divergence signal and MACD is showing potential for bearish wave. The descending red line on the left side of the chart indicates a long term bearish trend line; and as you can see, the price has already broken above it. Traders can be waiting for the price line to fall to the base line of the green channel as well as the gray zone, and then if any ascending trigger is issued, they can enter long positions. The target for the ascending wave could be consider on 23.099 and 24.68. Please note that if the price breaks below the gray zone, the chance foe an ascending wave to occur would highly reduce.
• DISCLAIMER: Please note that the above analysis is not an investment suggestion by “Capitalcore Ltd”. This post has been published only for educational purposes.