A bullish phase looks potential
After several reactions to its bearish trend line and its static support level, XAGUSD has formed a bearish triangle on the chart. The price line is currently approaching its static support line and some indicators are issuing bullish signals. An ascending wave looks potential on silver price chart.
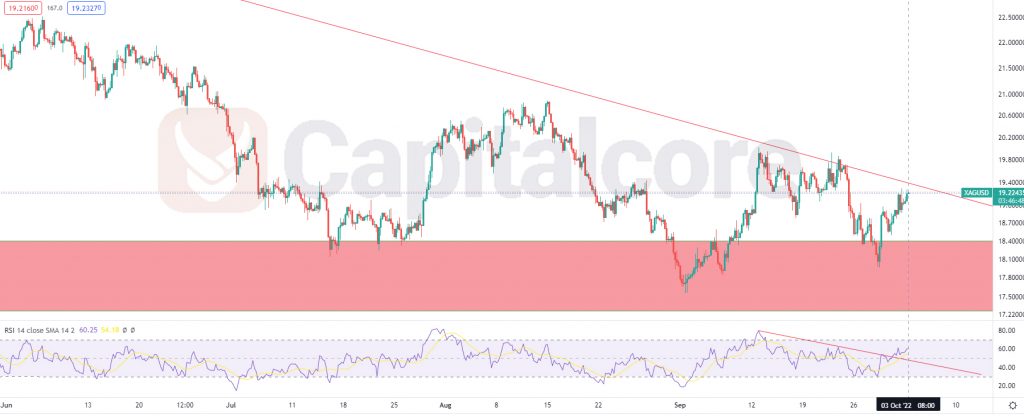
Chart Notes:
• Chart time-zone is UTC (+03:00)
• Candles’ time-frame is 4h.
The price line on Silver price chart is currently indicating 19.2160, where is located between the descending trend line, which has been reflected as a red descending line on the chart, and a static support level at 18.1 and 17.4, which is highlighted with light red. RSI indicator, unlike the price line, has broken above its resistance line and it could be expected for the price line to copy this motion in the next few upcoming days. Traders can be expecting for the price line to have another retest of the static resistance level, there they can enter long positions heading to 20.8642 and 22.01 after that. Also please consider that, in case the price line breaks below the resistance level at 17.00, the ascending chance would highly be reduced.
• DISCLAIMER: Please note that the above analysis is not an investment suggestion by “Capitalcore Ltd”. This post has been published only for educational purposes.