The price line is on a strong resistance level
Silver price started a bearish trend on 18th of April 2022; this wave caused the price line to descend more than 32.5% until the 1st of September 2022; and then enter a minor bullish leg. The price of Silver is now on a strong resistance zone which is not expected to get penetrated easily.
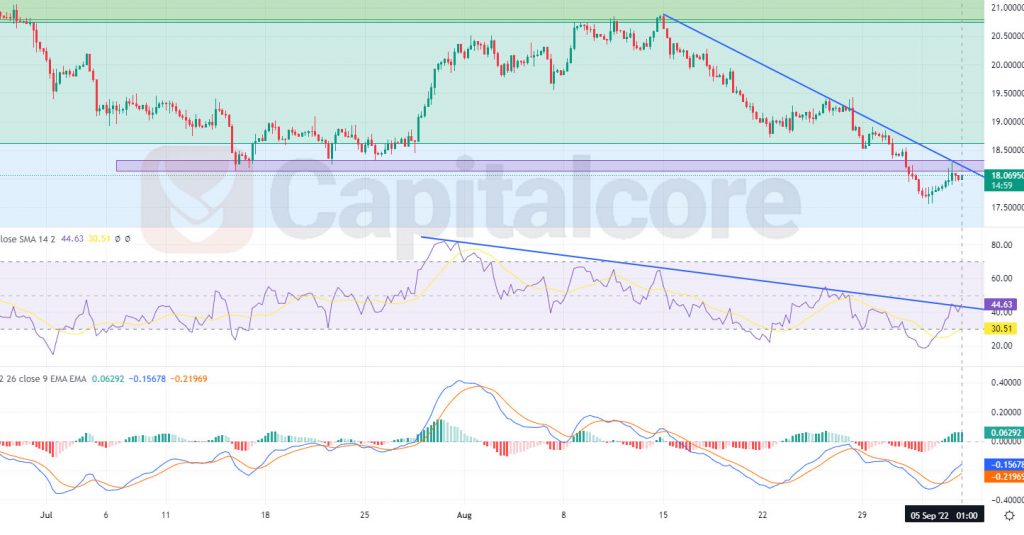
Chart Notes:
• Chart time-zone is UTC (+03:00)
• Candles’ time-frame is 4h.
The price line is now indicating 18.06950. This area is located just below a strong resistance level which is reflected as a violate area below the price line, the area is also collided with level 0.618 of the Fibonacci retracement. The blue line on the chart, indicates the trend lie which has formed the current descending wave. As you can see, RSI is also moving below a dynamic resistance level, also represented as a descending blue line, on the RSI. MACD is also showing bullish wave on going. Traders can be waiting for the price line to issue any bullish signals on shorter time frames then they can enter short positions, heading to 16.15486 and 14.04105 after that.
• DISCLAIMER: Please note that the above analysis is not an investment suggestion by “Capitalcore Ltd”. This post has been published only for educational purposes.