The support level looks too fragile to hold the price
The price line on Silver price chart started a bullish trend on 14th of October; and is now recovering the loss it had experienced in the previous descending phase. This ascending trend formed a bullish channel on the chart and the price line is still moving within this channel.
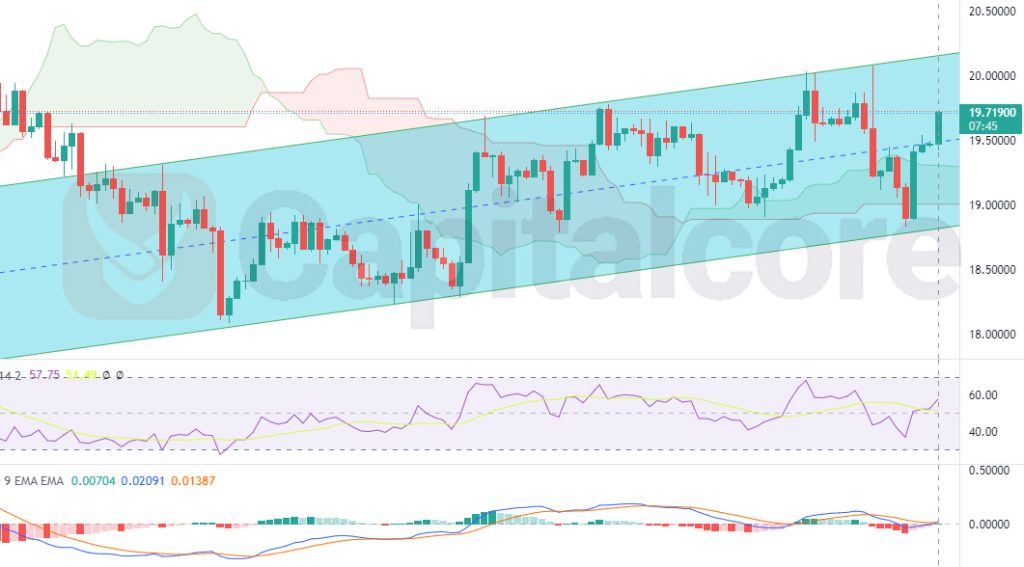
Chart Notes:
• Chart time-zone is UTC (+03:00)
• Candles’ time-frame is 4h.
The price line is currently showing 19.719 on the chart, which is located in the top half of the ascending channel. The mentioned bullish channel is highlighted with light blue color. Ichimiku Cloud has been broken and a pullback was made to it. RSI is moving towards overbuying zone, indicating almost 63 and the atmosphere looks proper for an ascending wave. MACD is also showing strong bullish signal, as the MACD line and Signal line are overlapping, the Histograms are also about to turn green. Buyers can maintain the control of the market.
• DISCLAIMER: Please note that the above analysis is not an investment suggestion by “Capitalcore Ltd”. This post has been published only for educational purposes.