Caution Ahead: RSI Indicates Overbought Conditions
The BTC/USDT chart presents a clear rising wedge pattern over the observed period. This pattern is known for its converging trend lines that encapsulate a series of higher lows and higher highs, suggesting an increasingly bullish market sentiment. However, it’s important to note that a rising wedge can often precede a bearish reversal, as the converging lines imply a weakening of upward momentum.
Within the wedge, the price is trading above the Ichimoku Cloud, indicating a strong bullish presence. The Cloud, not visible in the image but commonly known as Kumo, would typically offer support in this context, bolstering the positive outlook. Nevertheless, the upper boundary of the rising wedge could act as a resistance level, potentially limiting further upward movement.
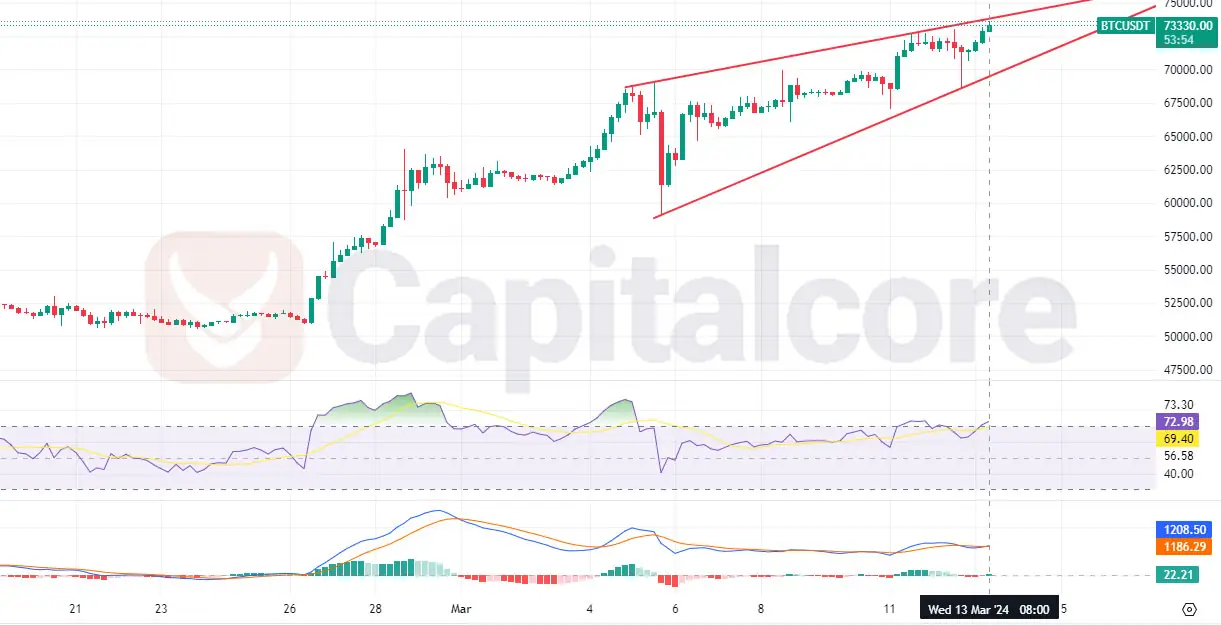
Chart Notes:
• Chart time-zone is UTC (+03:00)
• Candles’ time-frame is 4h.
The Relative Strength Index (RSI) appears to have entered the overbought territory, marked by an RSI level surpassing the 70 threshold. This could signal that the asset is potentially overvalued at the current level, prompting traders to anticipate a possible price correction. A subsequent downturn in the RSI would further support the expectation of a reversal, in line with the typical resolution of a rising wedge pattern.
While the Ichimoku Cloud is not depicted, we would expect the leading span A (Senkou Span A) and leading span B (Senkou Span B) to form the cloud’s boundaries. If BTC/USDT’s price remains above these spans, the bullish trend is confirmed. However, a drop below the cloud would suggest a shift in sentiment, and the cloud would then become a region of resistance.
The volume indicator shows declining trading activity as the price rises, which often accompanies the rising wedge formation. This decreasing volume may imply that the upward price movement is not supported by increasing trader interest or momentum, possibly foreshadowing a bearish reversal.
In summary, the BTC/USDT pair exhibits a bullish trend within a rising wedge, underscored by its position above the Ichimoku Cloud. However, the overbought RSI and declining volume caution against unbridled optimism. As traders frequently do, it would be prudent to monitor these indicators closely for signs of a bearish reversal that often follow such patterns, while also keeping an eye on other market dynamics and news that could influence sentiment and price action.
• DISCLAIMER: Please note that the above analysis is not an investment suggestion by “Capitalcore Ltd”. This post has been published only for educational purposes.