Trend reversal signals for Gold
Gold started an ascend on 30th of September and the price grew over 4.5% in 15 days. On 15th of October, Gold had a sharp descend (2% in tow days). 19th of October was the beginning of the next bullish wave. Right now the price is touching a very strong resistance and a bearish leg is expected.
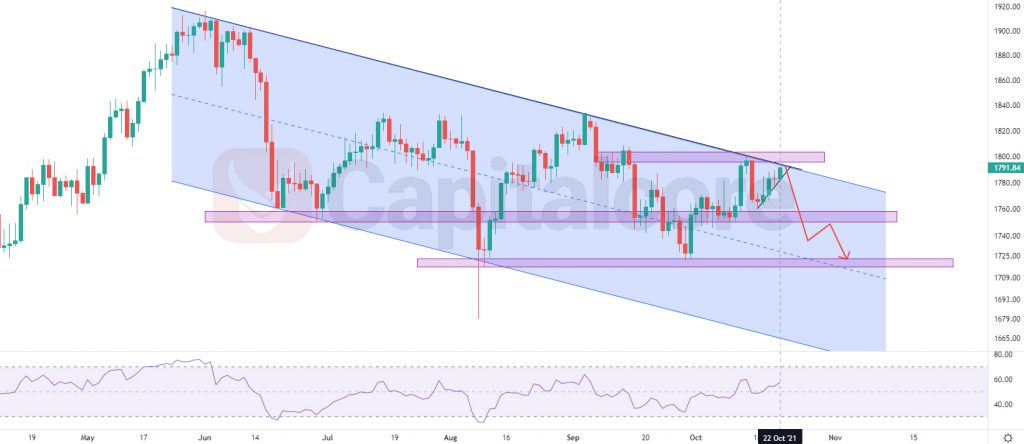
Chart Notes:
• Chart time-zone is UTC (+03:00)
• Candles’ time-frame is daily.
The price is currently touching a very strong resistance. The resistance is the top of the descending channel as well as a rich supply level. This resistance had been able to push the price down several times in the past. Bears can be waiting for any trigger for their trading set up. The first target for the descending wave could be 1760 ,which is a strong support and has pumped the price up several times and in case bears can hit the market stronger, sellers can be expecting to see the price at 1725, which is the mid line of the channel and has been able to pump the price several times in the past. On the other hand, breaking above 1810 at any point can be a trigger for bulls to take the market. in that case, bulls can target 1830 as their first TP and 1880 as the next one.
• DISCLAIMER: Please note that the above analysis is not an investment suggestion by “Capitalcore Ltd”. This post has been published only for educational purposes.