EUR/USD getting ready for a bullish wave
EUR/USD has been on a descending trend for the two past years and has descended almost 14.5% since 7th of January 2021, when the price line reached to a strong static support zone. The descending slope of the trend line then started to decrease and a bullish step looks to be potential of taking place
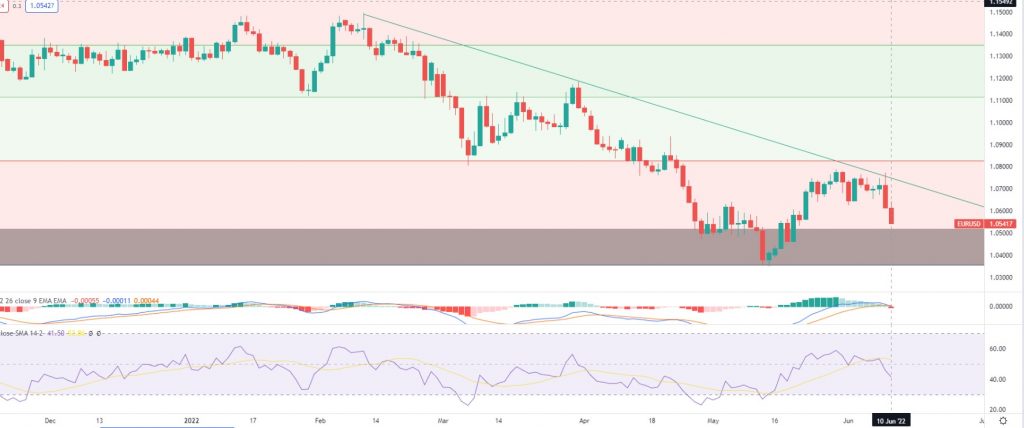
Chart Notes:
• Chart time-zone is UTC (+03:00)
• Candles’ time-frame is daily.
As you can see on the price chart, the price line is about to touch the static resistance for a second time. The support zone is indicated by gray color below the price line. The green descending line on the phase indicates the dynamic resistance which has formed the current descending wave. RSI is below 50 and has broken above its descending trend and is now showing potential for a bullish trend to occur. Traders can be waiting for the price line to reach to the support zone at 1.033 – 1.045; and then they can enter long positions heading to 1.085 and 1.11, which would be level 0.236 and 0.5 of the Fibonacci retracement on the previous major descending wave.
Please consider that, in case the price line breaks below the static support zone, the chance would be more with bears than the bulls.
• DISCLAIMER: Please note that the above analysis is not an investment suggestion by “Capitalcore Ltd”. This post has been published only for educational purposes.