Long or Short?
Japan released the 30-y Bond Auction and the US will publish Natural Gas Storage, Factory Orders m/m, Unemployment Claims, Trade Balance and Challenger Job Cuts y/y. This means both USD and JPY are strengthening; this is why, today we decided to analyze USD/JPY chart to see the effect of what has happened on this forex pair.
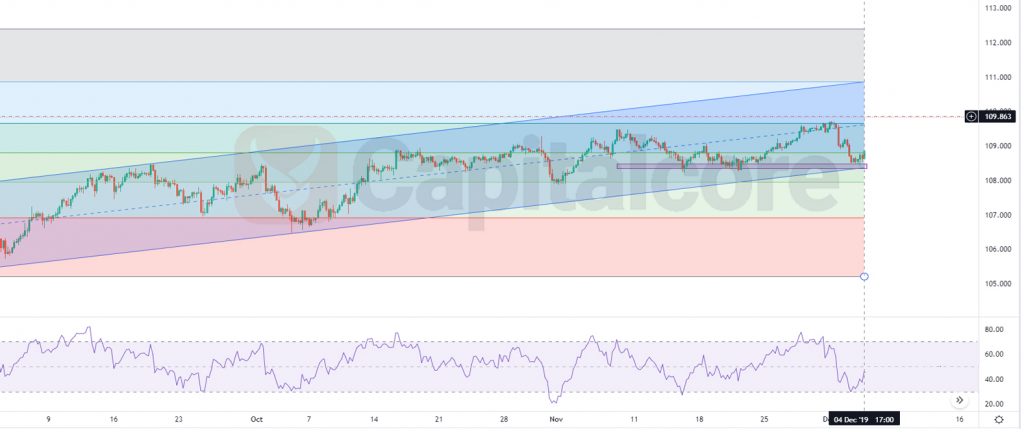
Chart Notes:
• Chart time-zone is UTC (+03:00)
• Candles’ time-frame is 4h.
The support rests at 108.580 with resistance at 108.980 which both lines are below the weekly pivot point at 109.270. The EMA of 10 is moving with bullish bias in the descendant channel and it is above the EMA of 200 and below the EMA of 100. The RSI is rising towards 50 level, the Stochastic is moving in high ranges and the MACD line is on the signal line in the neutral territory. The ADX is not showing any clear signals.
The resistance line seems to be too strong to be broken. The price will be fluctuating within the lower half of Bollinger band.
• DISCLAIMER: Please note that the above analysis is not an investment suggestion by “Capitalcore Ltd”. This post has been published only for educational purposes.