The ascending trend line is broken
UK100 chart indicates a big growth for this index, since 30th of October 2020. On 4th of March 2022, finally a sharp bearish candle broke below the ascending trend line. On 11th of March 2022, after the close of the weekly candle, the price line remans under the trend line and this indicates a hard week for UK100.
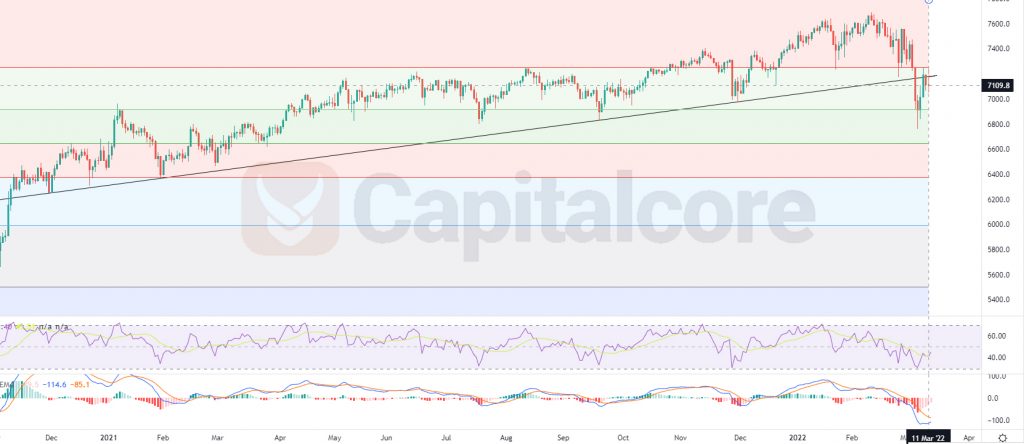
Chart Notes:
• Chart time-zone is UTC (+03:00)
• Candles’ time-frame is daily.
The weekly candle for UK100, closed on 7110.4. The black line on the chart shows the ascending trend line on the previous trend, which has recently been broken. The shadows on the previous candles shows that bears are more probable to take over the market in the next week. RSI is on 43 and MACD is showing weak descending trend on going. There are strong resistance levels above the current price on UK100; to point out some of them, we can mention level 0.236 of the Fibonacci retracement which lays around 7252 and also the trend line which is broken and is expected to shift to a resistance level. The support lines below the price line, which might be the target for the bearish wave, are level 0.618 of the Fibonacci retracement which would be almost equal to 6379 and also 5989, which would be level 0.786 of the Fibonacci retracement.
• DISCLAIMER: Please note that the above analysis is not an investment suggestion by “Capitalcore Ltd”. This post has been published only for educational purposes.