- April 24, 2023
- Category: Market News
Identifying potential entry points
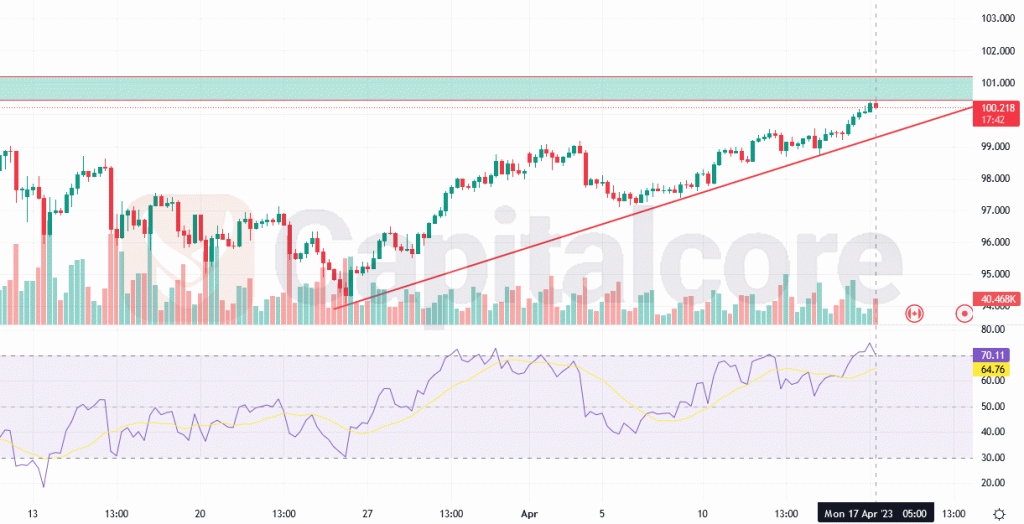
GBPUSD’s reduced motion range and proximity to the 66-day EMA suggest an imminent significant price move. Traders must monitor indicators to identify entry points and manage risk. Fundamental factors like central bank policies and geopolitical events may impact GBPUSD’s price.

Chart Notes:
• Chart time-zone is UTC (+03:00)
• Candles’ time-frame is 4h.
Traders should exercise caution and wait for a clear signal before entering positions, as the price could move sharply in either direction. To identify potential entry points, traders can look for a breakout above or below the Ichimoku cloud, a technical indicator that consists of several moving averages and a cloud area that represents potential support and resistance levels. A breakout above the cloud would signal a bullish trend, while a break below the cloud would indicate a bearish trend. Once a clear trend has been established, traders can enter positions in the same direction as the trend. It is important to note that technical analysis alone cannot predict future price movements with certainty, and traders should always use risk management strategies to limit potential losses. Additionally, fundamental factors such as economic data releases and geopolitical events may also impact the price of GBPUSD.
• DISCLAIMER: Please note that the above analysis is not an investment suggestion by “Capitalcore Ltd”. This post has been published only for educational purposes.