- October 4, 2024
- Posted By: james w
- Category: Market News
USD/CAD Bullish Momentum on H4 Chart
The USD CAD currency pair, also known as the “Loonie,” represents the exchange rate between the US dollar (USD) and the Canadian dollar (CAD). As a major forex pair, it is influenced by a variety of economic factors from both countries, including energy prices, monetary policies, and economic data releases. The Loonie pair is often traded by investors looking to capitalize on the strength or weakness of the US dollar relative to the Canadian dollar, with a particular focus on macroeconomic trends and oil price fluctuations.
Today’s economic calendar includes significant data releases such as the US Non-Farm Payrolls (NFP) and Unemployment Rate, which are likely to have a strong impact on USD performance. An increase in NFP or a lower-than-expected Unemployment Rate would bolster the USD, potentially pushing USDCAD price higher, while weaker-than-expected data could weigh on the currency. Meanwhile, Canada’s Ivey PMI, a key gauge of business conditions, is also in focus. A stronger-than-forecast reading from the PMI would be bullish for the CAD, potentially limiting any USD strength. Additionally, hawkish comments from John Williams of the Federal Reserve could boost the dollar as traders anticipate tighter monetary policy in the future. All these factors create a high level of volatility in the USD/CAD market, making today a key moment for traders of the pair.

Chart Notes:
• Chart time-zone is UTC (+03:00)
• Candles’ time-frame is 4h.
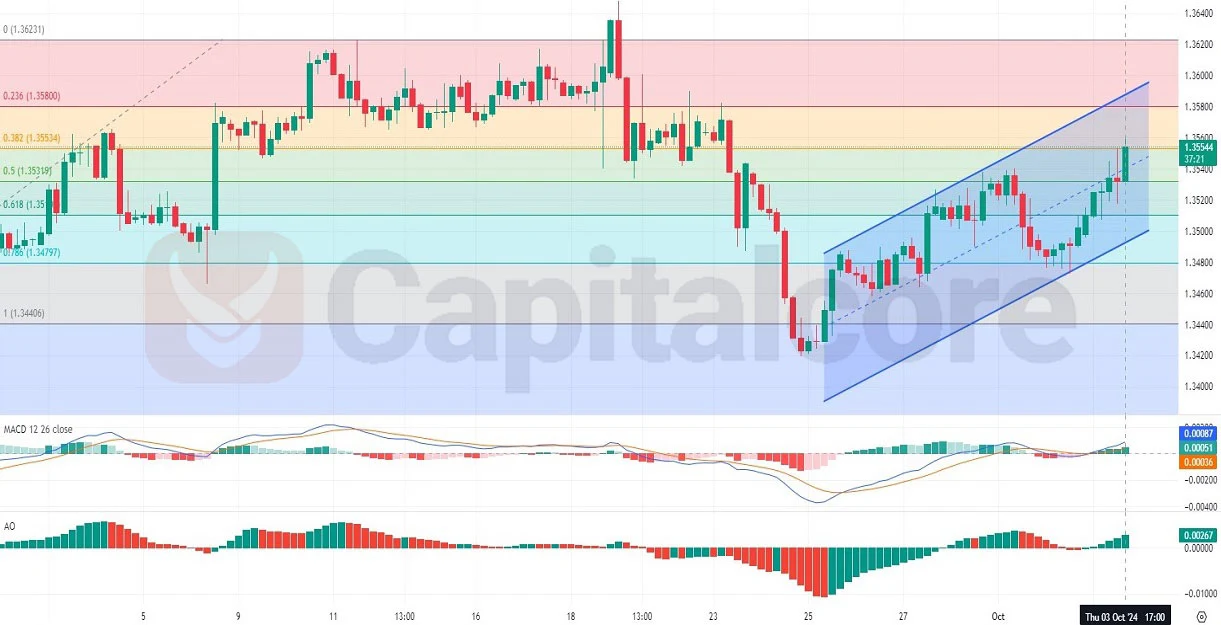
On the technical side, the USD/CAD H4 chart shows a clear bullish trend, with 8 of the last 10 candles closing in the green. The price is currently testing the 0.382 Fibonacci retracement level at 1.35534, with bullish momentum pushing towards higher levels. The MACD histogram is showing increasing bullish momentum, and the MACD lines are in the process of a bullish crossover, signaling continued upward pressure. The Awesome Oscillator (AO) is also positive, reinforcing the bullish sentiment. The USD/CAD price is trading within a rising channel, indicating a steady uptrend, and if it breaks through the 0.382 Fibonacci level, the next resistance is likely at the 0.236 level around 1.35800. Overall, the chart signals potential further upside, but the 1.35534 level remains a crucial hurdle for bulls to overcome.
DISCLAIMER: Please note that the above analysis is not an investment suggestion by “Capitalcore LLC”. This post has been published only for educational purposes.