- November 24, 2022
- Category: Market News
The bullish Power seems to be decreasing
After a significant ascending wave, the price line on USD/CAD price chart went through a correction phase and the price on this pair experienced a 5.28% dump, causing the price line to fall to a rich demand zone. At the moment different indicators are issuing trend reversal signal and the descending slope of the chart has decreased.
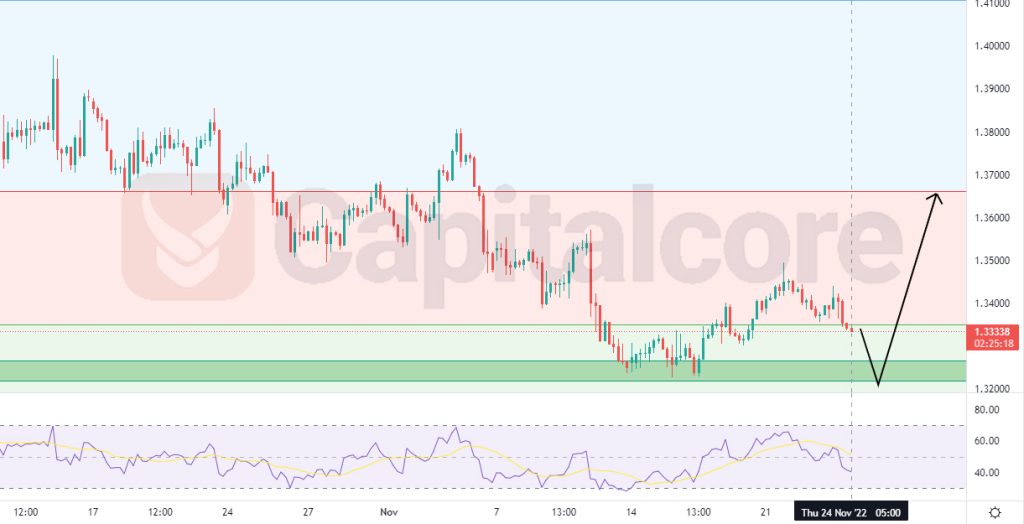
Chart Notes:
• Chart time-zone is UTC (+03:00)
• Candles’ time-frame is 4h.
The price line is currently showing 1.33338, that would be located just below level 0.5 of the Fibonacci retracement on the previous major descending wave, and just above a strong support zone, indicated as a green area below the price line. The mentioned support zone is of high importance for the buyers, as it has already been able to stop bearish phases, several times in the past. RSI is showing almost 50 and has started a bullish trend. The price line has recently been able to form higher climaxes and valleys, stipulating weakness of the bears. Sellers should keep a sharp eye on the price line of this pair to hunt the price line having any other retest of the support zone colored in light green, then they can enter long positions heading to 1.34445 and 1.366 after that. Also consider that, in case the price line breaks below 1.321, the chance of a bullish wave would be brought under question.
• DISCLAIMER: Please note that the above analysis is not an investment suggestion by “Capitalcore Ltd”. This post has been published only for educational purposes.