Calm market for USD/CAD
BOC Governor Stephen Poloz speaks today. On the chart, the price is bouncing between a support and resistance level. Traders can take short term positions, but for long-tern-goal traders it is mostly recommended to avoid trading until an ascending or descending trend is formed.
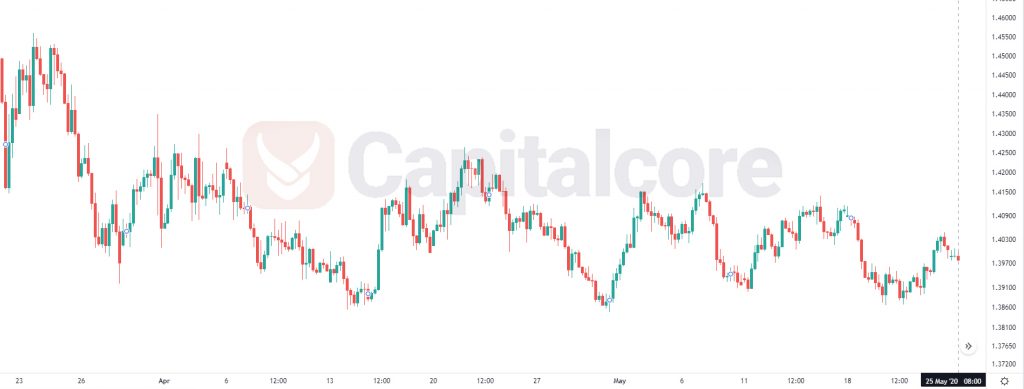
Chart Notes:
• Chart time-zone is UTC (+03:00)
• Candles’ time-frame is 4h.
The pair is finding support at 1.39610 with resistance at 1.40240 which the weekly pivot point at 1.39960 is located in between the lines. The EMA of 10 is moving with bullish bias in the ascendant channel and it is located below the EMA of 200 and the EMA of 100. The RSI is moving on 50 level, the MACD line is above the signal line in the positive territory and the Stochastic is showing downward momentum. The ADX is not showing any clear signals. The price is in the Ichimoku Cloud and above the Chinkou Span. The Tenkan-sen is showing an upward trend while the Kijun-sen is showing a horizontal trend.
The indicators are showing mixed signals. It seems that USDCAD is fluctuating within the support and resistance lines today.
• DISCLAIMER: Please note that the above analysis is not an investment suggestion by “Capitalcore Ltd”. This post has been published only for educational purposes.