The price is moving horizontally
USDCAD is massively under the influence of the economic reports such as Balance of Trade and Inflation Rate in Canada and the US will release Wholesale Inventories MoM and Balance of Trade. On the chart the price is moving within a horizontal channel.
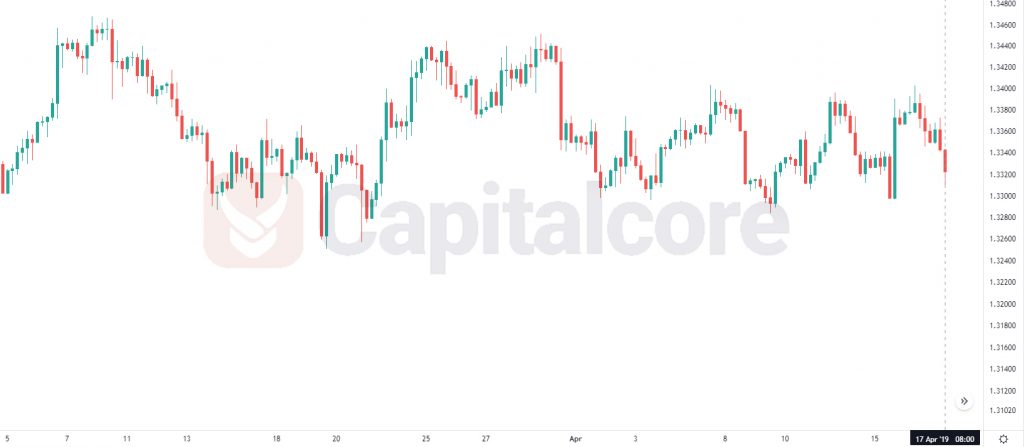
Chart Notes:
• Chart time-zone is UTC (+03:00)
• Candles’ time-frame is 4h.
The pair is finding support at 1.32970 with resistance at 1.33630 which the weekly pivot point at 1.33370 is located in between the lines. The EMA of 10 is moving with bearish bias in the horizontal channel and it is located above the EMA of 200 and the EMA of 100. The RSI is moving below the 50 level, the MACD line is below the signal line in the negative territory and the Stochastic is moving in low ranges. The ADX is showing sell signal. The price is below the Ichimoku Cloud and above the Chinkou Span. The Tenkan-sen is showing a downward trend while the Kijun-sen is showing a horizontal trend.
USDCAD will be fluctuating within the support and resistance area.
• DISCLAIMER: Please note that the above analysis is not an investment suggestion by “Capitalcore Ltd”. This post has been published only for educational purposes.