Where is the descending wave heading to?
Housing Starts and Manufacturing Shipments will be released in Canada and the US will publish Import price index, Industrial Production, Manufacturing Production and Capacity Utilization. This is enough to alter the movement of the market and start new trends, but is that really gonnat happen?
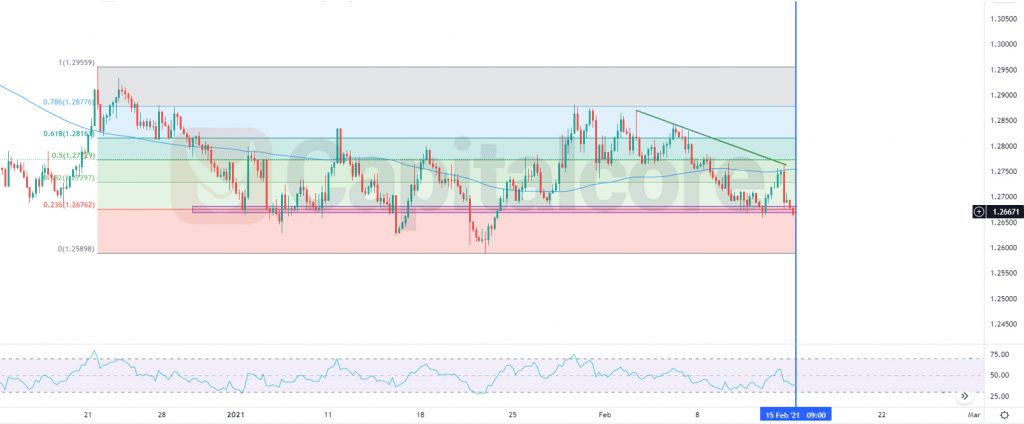
Chart Notes:
• Chart time-zone is UTC (+03:00)
• Candles’ time-frame is 4h.
The pair is finding support at 1.27280 with resistance at 1.27890 which the weekly pivot point at 1.27680 is located in between the lines. The EMA of 10 is moving horizontally in the descendant channel and it is located below the EMA of 200 and the EMA of 100. The RSI is rising towards level 50, the MACD line is above the signal line in the positive territory and the Stochastic is moving in middle ranges. The ADX is showing sell signal. The price is below the Ichimoku Cloud and the Chinkou Span. The Tenkan-sen and the Kijun-sen are both showing a horizontal trend.
Short positions are recommended towards 1.26500.
• DISCLAIMER: Please note that the above analysis is not an investment suggestion by “Capitalcore Ltd”. This post has been published only for educational purposes.