The support level looks too fragile to hold the price
Unemployment Rate, Employment Change and Part Time Employment Change were published in Canada and the US will release Average Hourly Earnings, Unemployment Rate and Non-Farm Payrolls. On the price chart, bears are pushing the price line down; the price is currently on a support level but bears look more powerful than the support level.
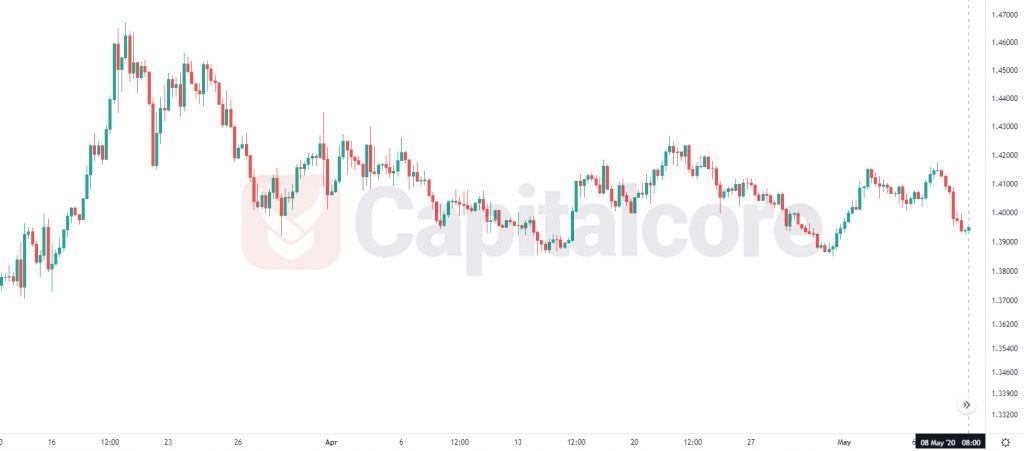
Chart Notes:
• Chart time-zone is UTC (+03:00)
• Candles’ time-frame is 4h.
The pair is finding support at 1.39060 with resistance at 1.39690 which both lines are below the weekly pivot point at 1.40180. The EMA of 10 is moving with bearish bias in the descendant channel and it is located below the EMA of 200 and the EMA of 100. The RSI is moving in oversold area, the MACD line is below the signal line in the negative territory and the Stochastic is moving in low ranges. The ADX is showing sell signal. The price is below the Ichimoku Cloud and above the Chinkou Span. The Tenkan-sen is showing a downward trend while the Kijun-sen is showing a horizontal trend.
Short positions are recommended towards 1.38800.
• DISCLAIMER: Please note that the above analysis is not an investment suggestion by “Capitalcore Ltd”. This post has been published only for educational purposes.