The price line is on an strong support
Inflation Rate in the US and Canada will be the most influential factors for USDCAD. On the chart the price is on a strong support level, as well as the mid line of an ascending channel. Different indicators are issuing buy signal and the overall look of the chart is bullish.
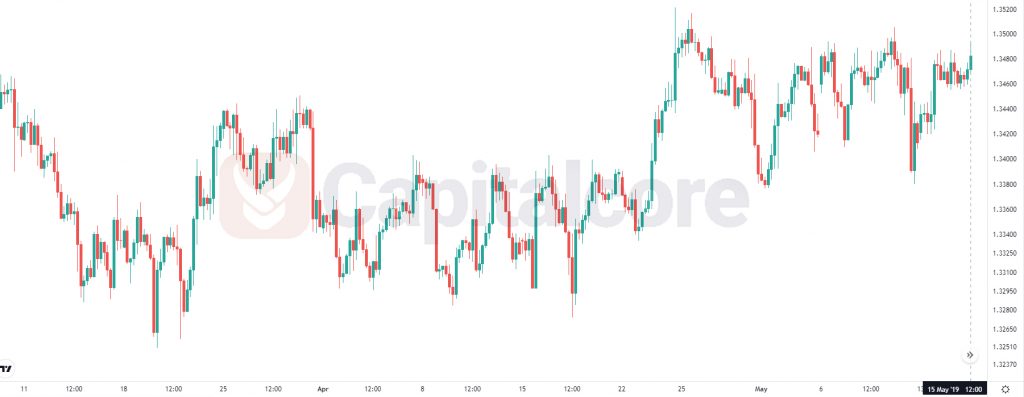
Chart Notes:
• Chart time-zone is UTC (+03:00)
• Candles’ time-frame is 4h.
The pair is finding support at 1.34430 with resistance at 1.34780 which both lines are above the weekly pivot point at 1.34330. The EMA of 10 is moving with bullish bias in the ascendant channel and it is located above the EMA of 200 and the EMA of 100. The RSI is moving on 50 level, the MACD line is above the signal line in the positive territory and the Stochastic is showing downward momentum. The ADX is showing buy signal. The price is above the Ichimoku Cloud and the Chinkou Span. The Tenkan-sen is showing an upward trend while the Kijun-sen is showing a horizontal trend.
The indicators are showing mixed signals. While considering pullbacks on the way, buyers can target 1.35000.
• DISCLAIMER: Please note that the above analysis is not an investment suggestion by “Capitalcore Ltd”. This post has been published only for educational purposes.