Support level does'nt look to be broken
Canada will release Housing Starts and Building Permits. On the chart the price has had a correction after a strong ascend. The price then, started a side market, flouting between a support and resistance level. Currently some indicators are showing buy level, the overall look of the chart is bullish as well.
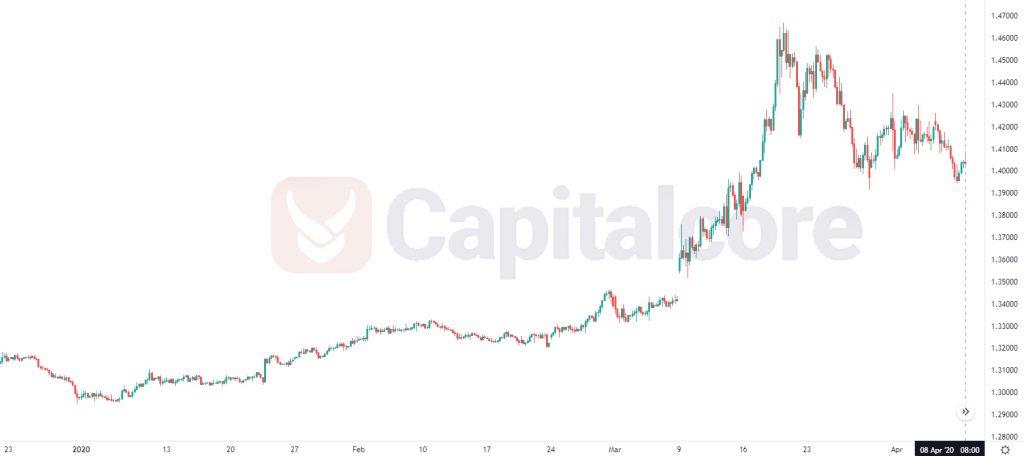
Chart Notes:
• Chart time-zone is UTC (+03:00)
• Candles’ time-frame is 4h.
The pair is finding support at 1.39870 with resistance at 1.41100 which both lines are below the weekly pivot point at 1.41850. The EMA of 10 is moving horizontally in the horizontal channel and it is located above the EMA of 200 and below the EMA of 100. The RSI is rising towards 50 level, the MACD line is below the signal line in the negative territory and the Stochastic is showing upward momentum. The ADX is not showing nay clear signals. The price is below the Ichimoku Cloud and above the Chinkou Span. The Tenkan-sen is showing a downward trend while the Kijun-sen is showing a horizontal trend.
Long positions are recommended towards 1.42000.
• DISCLAIMER: Please note that the above analysis is not an investment suggestion by “Capitalcore Ltd”. This post has been published only for educational purposes.