Bulls look to be tired
USD/CAD started an uptrend within within a channel. The price Right now is at the top line of the channel as well as level 0.236 of the Fibonacci retracement. Different indicators are issuing sell signal and overall look of the chart is bearish.
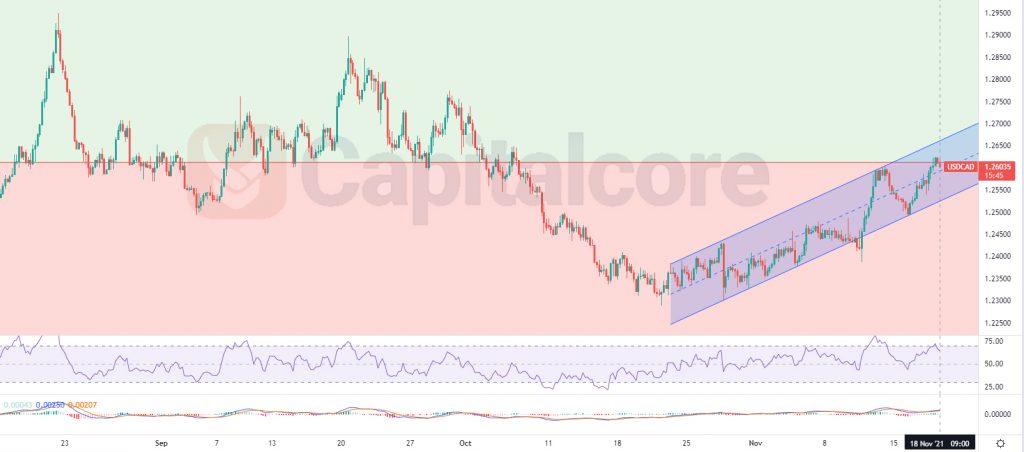
Chart Notes:
• Chart time-zone is UTC (+03:00)
• Candles’ time-frame is 4h.
There is a strong resistance at about 1.26, the area equals to 0.236 of the previous significant descending wave; The area has been able to dump the price several times in the past and therefore is considered a strong resistance. RSI indicator is moving towards 50 and is also showing negative divergence. Bearish leg sounds to be starting. In case the price line breaks below the mid line of the channel, bears can target the base line of the chart that would be somewhere around 1.2545.
• DISCLAIMER: Please note that the above analysis is not an investment suggestion by “Capitalcore Ltd”. This post has been published only for educational purposes.