the price is at the bottom of the channel
Overnight Rate and BOC Rate Statement will be released in Canada and the US will publish ISM Non-Manf. and Crude Oil Inventories. On the chart, the price is going through an ascending channel. The price is at the base line of the channel and the overall look of the chart is bullish.
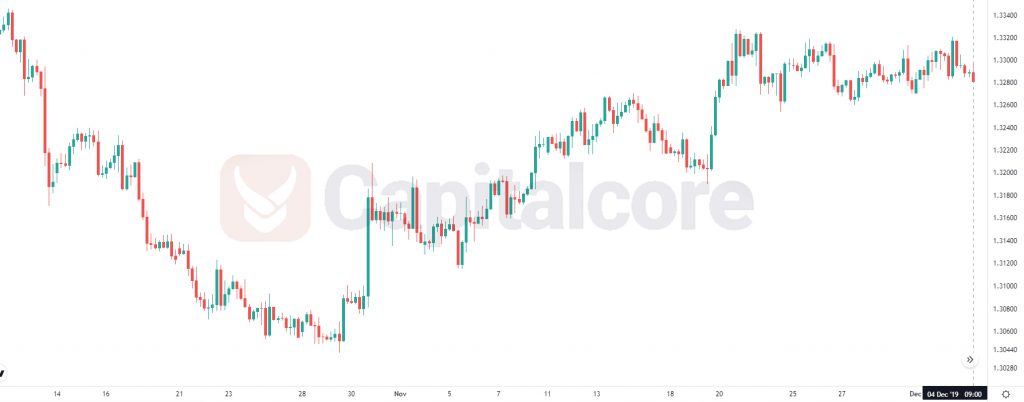
Chart Notes:
• Chart time-zone is UTC (+03:00)
• Candles’ time-frame is 4h.
The pair is finding support at 1.32780 with resistance at 1.33170 which the weekly pivot point at 1.32850 is located in between the lines. The EMA of 10 is moving with bearish bias in the ascendant channel and it is located above the EMA of 200 and the EMA of 100. The RSI is moving below 50 level, the MACD line is below the signal line in the negative territory and the Stochastic is moving in low ranges. The ADX is not showing any clear signals. The price is below the Ichimoku Cloud and the Chinkou Span. The Tenkan-sen and the Kijun-sen are both showing a horizontal trend.
While considering pullbacks on the way buyers can target 1.3320.
• DISCLAIMER: Please note that the above analysis is not an investment suggestion by “Capitalcore Ltd”. This post has been published only for educational purposes.