- June 27, 2022
- Category: Market News
Trend reversal has occurred
USD/CAD price started a bullish rally on 8th of June 2022; This rally could pump the price about 4.43% until 17th of June 2022, when it reached to level 0.382 of the Fibonacci retracement on the previous major bearish wave. The price bullish power then started to decrease and currently some bearish signals have been issued.
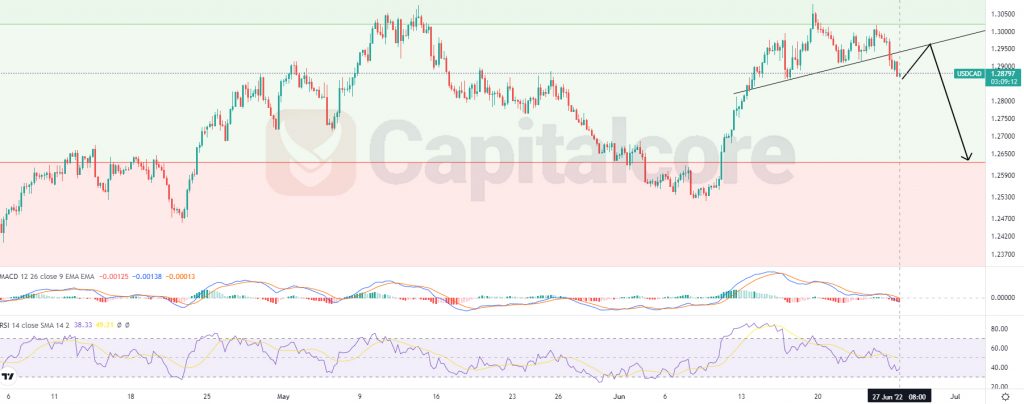
Chart Notes:
• Chart time-zone is UTC (+03:00)
• Candles’ time-frame is 4h.
The price line is currently indicating 1.28797 which would be under a dynamic support that has currently been broken. The black ascending line indicates this dynamic support. As you can see, after the sharp ascending wave, the ascending slope of the price line started to decreased and the support line was formed, on 24th of June this support zone was broken and the descending potential of the chart has increased largely. MACD and RSI are both issuing bearish signals, Traders can be waiting for the price line to have another retest of the broken support and them they can enter short positions heading to 1.265 and 1.25 after that.
• DISCLAIMER: Please note that the above analysis is not an investment suggestion by “Capitalcore Ltd”. This post has been published only for educational purposes.