- July 26, 2022
- Category: Market News
Trend reversal looks potential
After a sharp descending rally on USD/CAD, the bearish slope of the price line started to decrease and could reach out to level 0.5 on the previous major ascending wave. The bearish market is still on going on this pair, the descending power, however has decreased significantly. Some descending signals have been issued and a trend reversal could be expected to occur shortly.
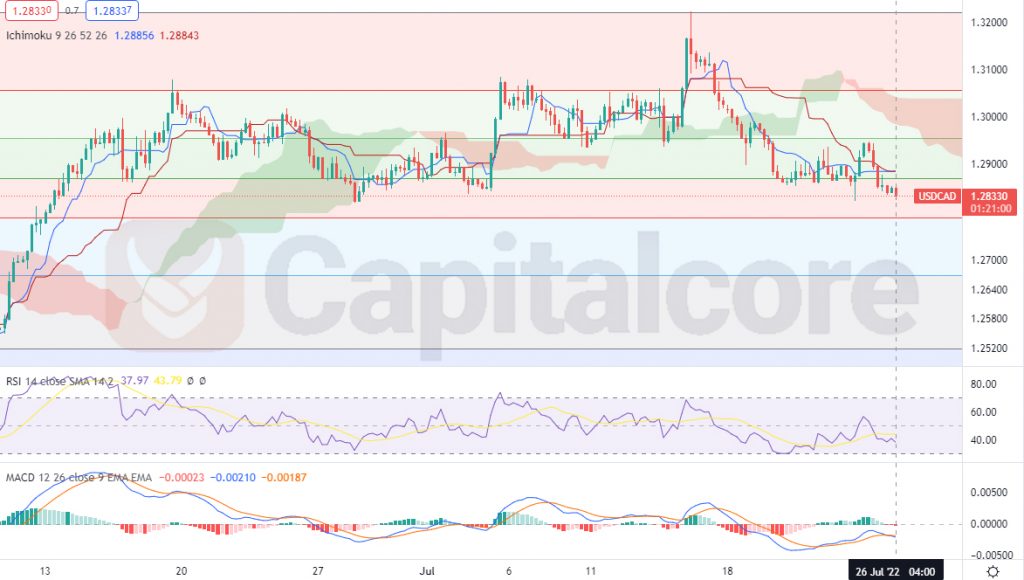
Chart Notes:
• Chart time-zone is UTC (+03:00)
• Candles’ time-frame is 4h.
The price line on USD/CAD price chart is currently indicating 1.28330; this area is located just between level 0.5 and 0.618 of the Fibonacci retracement. A quick review of the price line in the previous reactions to this area reflects the validity of this support zone. RSI is currently indicating almost 39 and MACD is showing a weak bearish wave on going. Ichimoku cloud is located above the price line, indicated as a light red area. Conversion Line (Tenkan Sen) is about to break above Base Line (Kijun Sen), which could be predicting a bullish wave on the way. Buyers can be waiting for the price line to touch 0.618 of the Fibonacci retracement, which leys at about 1.28. The target for the upcoming bullish wave could be considered on 1.295 and 1.305. Please note that, in case the price line issues any daily candles being closed below level, below 1.279, the chance would be more with sellers than the buyers.
• DISCLAIMER: Please note that the above analysis is not an investment suggestion by “Capitalcore Ltd”. This post has been published only for educational purposes.