- May 12, 2022
- Category: Market News
Bearish signals have been issued
USD/CAD price line started a bullish rally on 21st of April 2022 and the price has already ascended about 4.75% and is now on a strong weekly resistance level. Some descending patterns are visible on the chart and some bearish signals have also been issued.
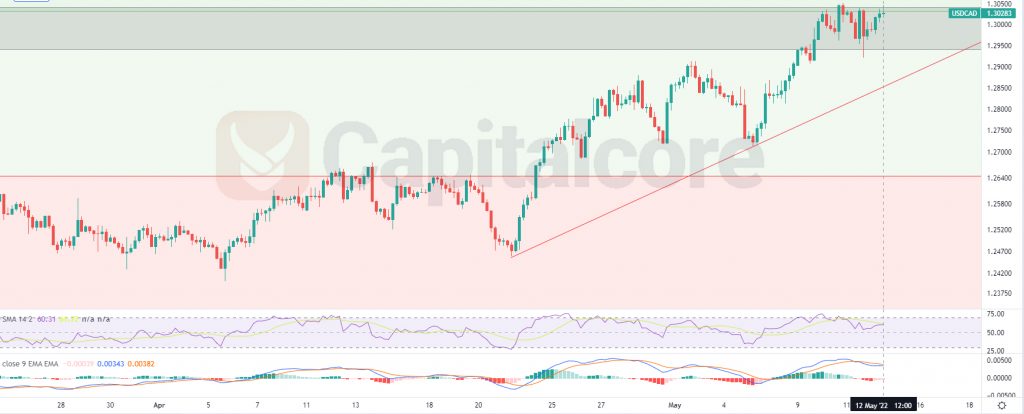
Chart Notes:
• Chart time-zone is UTC (+03:00)
• Candles’ time-frame is 4h.
On USD/CAD price chart, the price line is on 1.30283 at the moment, which would be just inside the weekly resistance on this pair. Bullish power looks to be weakening and bears are about to take the control of the market. Currently the price has not been able to break above this zone, despite making several attempts. The red line on the chart, indicates the trend line which has formed the current wave and the gray area indicates the weekly resistance zone, which also coincides with level 0.382 of the Fibonacci retracement on the previous major descending wave on weekly time frame. RSI has issued negative divergence and MACD is showing week bearish wave on going.
traders can be waiting for the price line to break below the trend line and then they can enter short positions on the retest of the area. The targets for the bearish wave could be considered on 1.265 and 1.247.
Please note that the possibility of occurring of the mentioned bearish wave would highly reduce if the price line breaks above the resistance level.
• DISCLAIMER: Please note that the above analysis is not an investment suggestion by “Capitalcore Ltd”. This post has been published only for educational purposes.