Can Raw Materials Price Index and Building Permits publication rescue USD/CAD?
Industrial Product Price Index, Raw Materials Price Index and Building Permits will be published in Canada. This publication will effect market greatly, as it is predicted. in the following we have prepared the price chart of USD/CAD for you. we have also put a short analysis of the chart right after.
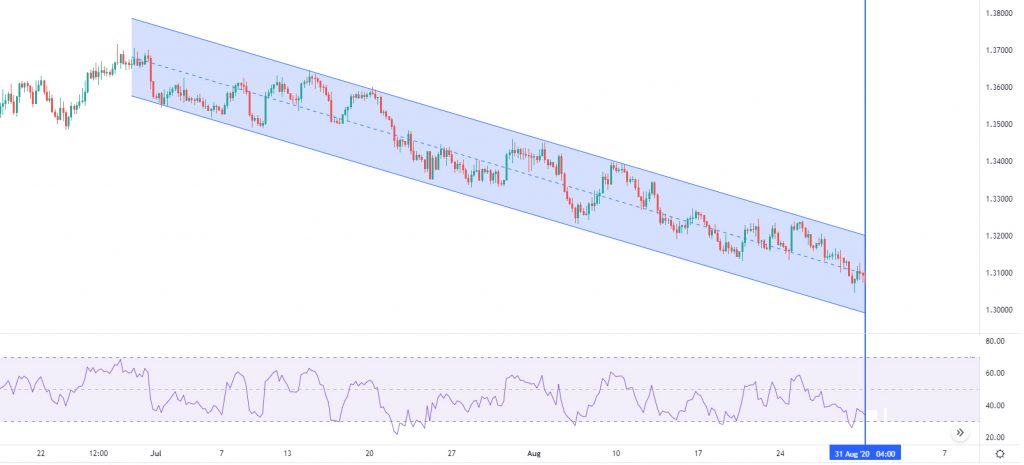
Chart Notes:
• Chart time-zone is UTC (+03:00)
• Candles’ time-frame is 4h.
The pair is finding support at 1.30450 with resistance at 1.31410 which the weekly pivot point at 1.31280 is located in between the lines. The EMA of 10 is moving with bearish bias in the descendant channel and it is located below the EMA of 100 and the EMA of 200. The RSI is moving in oversold area, the MACD line is below the signal line in the negative territory and the Stochastic is showing downward momentum. The ADX is showing sell signal. The price is below the Ichimoku Cloud and the Chinkou Span. The Tenkan-sen is showing a downward trend while the Kijun-sen is showing a horizontal trend.
Short positions are recommended towards 1.30150.
• DISCLAIMER: Please note that the above analysis is not an investment suggestion by “Capitalcore Ltd”. This post has been published only for educational purposes.