Ranged market or start of a ascending trend?
Trade Balance and Ivey Purchasing Managers Index will be released in Canada and the US will publish Unemployment Rate and Non-Farm Payrolls. These will cause a major forex change in pairs based on USD and CAD. USD/CAD chart will be analyzed in the following; in case you are going to open or manage ant trades based on these two currencies, this will be helpful for you.
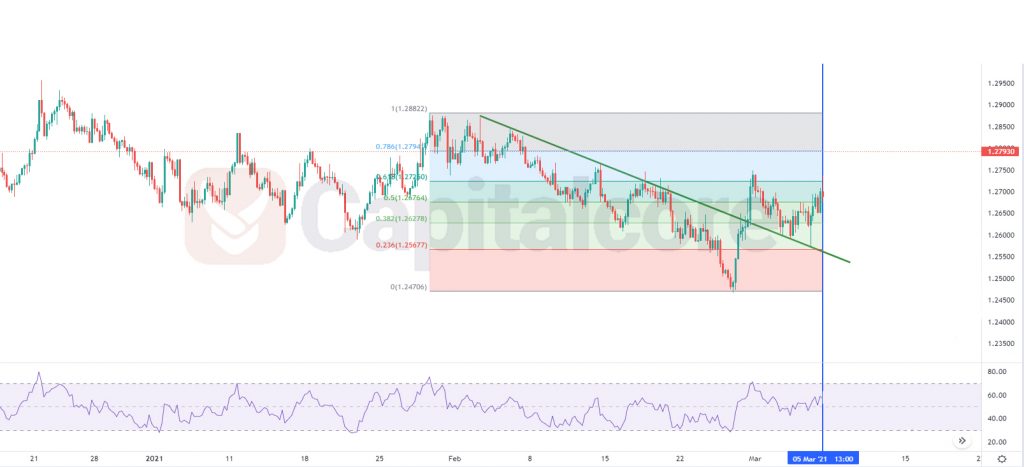
Chart Notes:
• Chart time-zone is UTC (+03:00)
• Candles’ time-frame is 4h.
The pair is finding support at 1.25960 with resistance at 1.27220 which the weekly pivot point at 1.26470 is located in between the lines. The EMA of 10 is moving with bullish bias in the ascendant channel and it is located below the EMA of 200 and above the EMA of 100. The RSI is moving in overbought area, the MACD line is above the signal line in the positive territory and the Stochastic is moving in high ranges. The ADX is not showing any clear signals. The price is above the Ichimoku Cloud and above the Chinkou Span. The Tenkan-sen is showing a horizontal trend and the Kijun-sen is showing a downward trend.
There are no clear signals it seems that USDCAD is trying to consolidate within the support and resistance lines.
• DISCLAIMER: Please note that the above analysis is not an investment suggestion by “Capitalcore Ltd”. This post has been published only for educational purposes.