The ascending trend line is broken.
USD/CAD market has been bullish lately. the price line started an ascending trend since 21st of October and could grow about 1.6 % in almost 20 days. After that in 9th of November, the ascending trend line was broken. different indicators are issuing sell signals and the overall look of the chart is bearish.
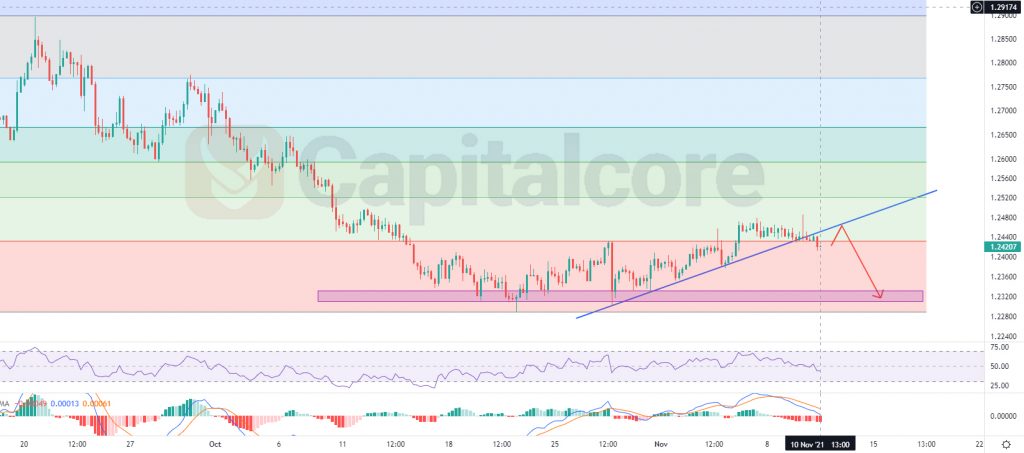
Chart Notes:
• Chart time-zone is UTC (+03:00)
• Candles’ time-frame is 4h.
after reaching the support level on 1.23 – 1.2316 the price line started an ascend and could grow up to level 236 of the Fibonacci retracement on the previous descending line. Right now the trendline is broken and the price has fallen below 0.236 once more. Bears here can wait for the price line to have another retest of the broken trend line; then a bearish wave could be expected. Bears can target 1.2315 as their first TP and 1.21444 as the second one. please note that breaking above the blue line highly reduces the chance of the descend.
• DISCLAIMER: Please note that the above analysis is not an investment suggestion by “Capitalcore Ltd”. This post has been published only for educational purposes.