The price line is on a critical spot
USD/CAD started an ascending wave on 18th pf the March. The price was on 0.661 on 19th of March and could reach out to 0.753 on the first of April. Then, the price line started a side way range and at the moment it is on a critical spot. The next move of the price could be really important.
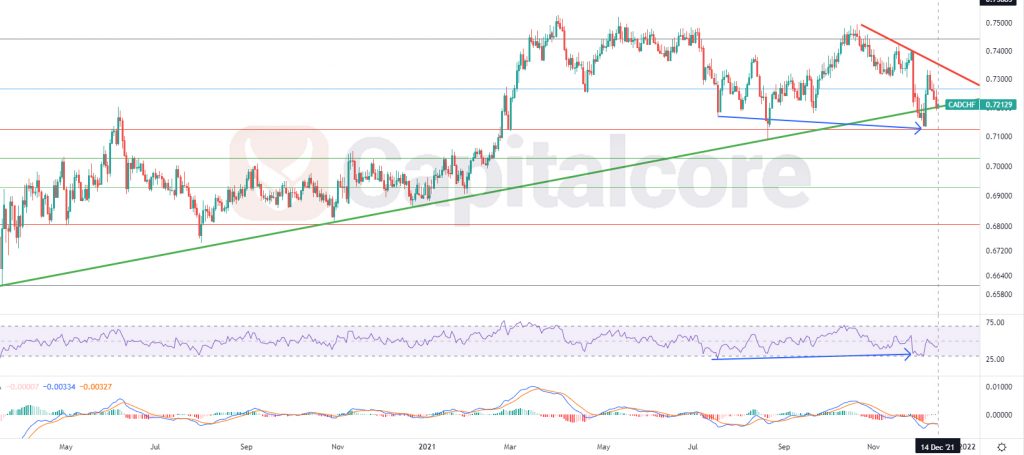
Chart Notes:
• Chart time-zone is UTC (+03:00)
• Candles’ time-frame is daily.
The price, at the moment is on 0.7213. The green thick line indicates the strong dynamic support level that has been valid for almost two years. RSI indicator is almost on 44 and has issued a positive divergence signal, which has been shown by a blue arrow. MACD is showing the weakening of the descending phase and is almost issuing buy signal. the overall look of the chart is bullish. Buyers can be waiting for the price line to break above the red line and on the retest of that area, buyers cat enter a trade and based on their risk apatite, can target0.7444 or 0.76125. for long time traders, 0.7948 could also be a possible target. Please consider that breaking below 0.713, reduces the possibility of the ascending wave.
• DISCLAIMER: Please note that the above analysis is not an investment suggestion by “Capitalcore Ltd”. This post has been published only for educational purposes.