- July 23, 2019
- Category: Market News
Bearish trendline is broken
While CAD is staying flat, USD is being supported by macroeconomic data. In the chart the price line has broken out of the descending trendline and now the overall look of the chart is bullish. Different indicators are issuing trend reversal signal and a bullish step is expected.
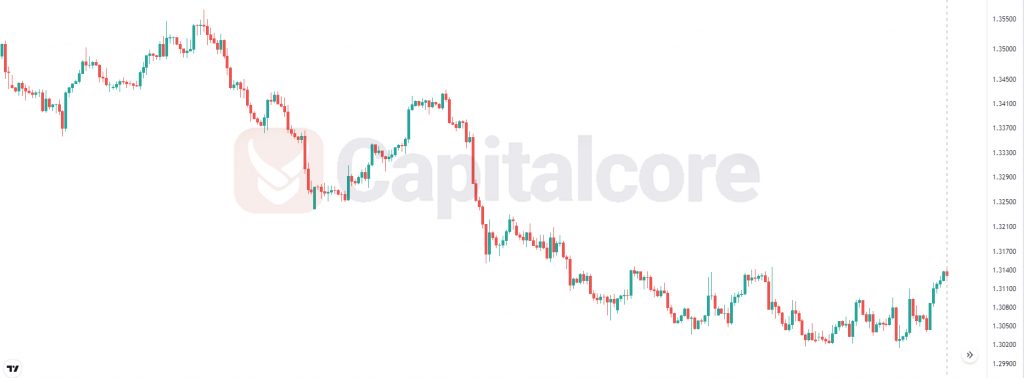
Chart Notes:
• Chart time-zone is UTC (+03:00)
• Candles’ time-frame is 4h.
The pair is finding support at 1.31100 with resistance at 1.31610 which both lines are above the weekly pivot point at 1.30620. The EMA of 10 is moving with bullish bias in the ascendant channel and it is located below the EMA of 200 and above the EMA of 100. The RSI is falling towards 50 level, the MACD line is above the signal line in the positive territory and the Stochastic is moving in high ranges. The ADX is showing buy signal. The price is above the Ichimoku Cloud and below the Chinkou Span. The Tenkan-sen and the Kijun-sen are both showing an upward trend.
Long positions are recommended towards 1.32000.
• DISCLAIMER: Please note that the above analysis is not an investment suggestion by “Capitalcore Ltd”. This post has been published only for educational purposes.