Impact of Economic Indicators on USD/CAD
Attention traders, the USD/CAD price is currently hovering around 2.35000. The price line has been reducing its movement range and is now on a resistance level. The RSI (Relative Strength Index) is moving towards 70, indicating that the price may be overvalued and due for a pullback or correction. However, traders should expect the price line to go through a bullish wave.
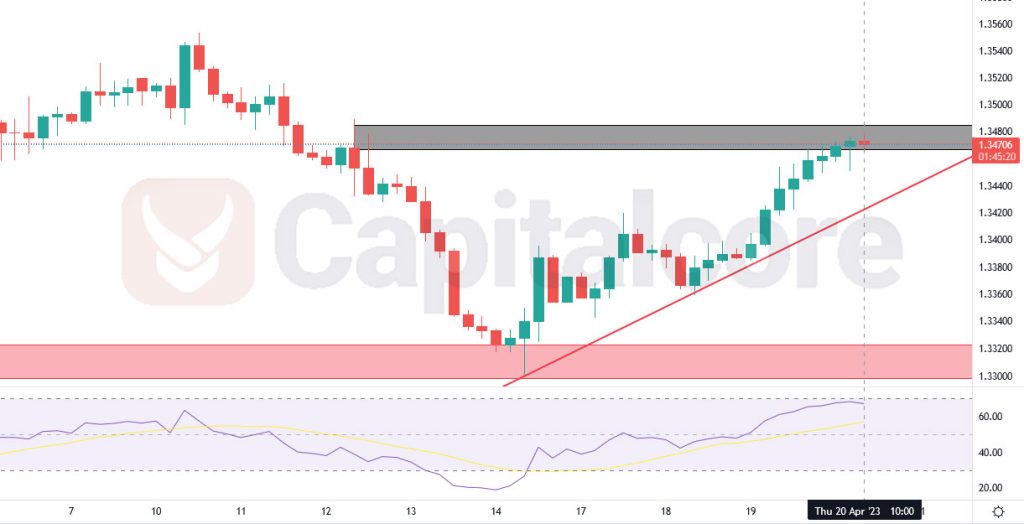
Chart Notes:
• Chart time-zone is UTC (+03:00)
• Candles’ time-frame is 4h.
It is important to note that after seeing negative divergence, traders can enter short positions. Negative divergence occurs when the price makes a higher high, but the indicator (in this case, RSI) makes a lower high, suggesting a potential reversal in momentum. However, traders should consider multiple indicators and market conditions before making any trades. As always, traders should use proper risk management techniques when entering trades, such as setting stop-loss orders and monitoring market conditions closely. Stay informed and trade responsibly.
• DISCLAIMER: Please note that the above analysis is not an investment suggestion by “Capitalcore Ltd”. This post has been published only for educational purposes.