Loonie Shows Bullish Potential on H4
USD/CAD, commonly referred to as the “Loonie” due to the image of a loon on the Canadian one-dollar coin, is showing potential bullish momentum on the H4 chart. Currently, the pair is trading below a descending bearish trend line, which has acted as a strong resistance barrier. The RSI is indicating bullish potential, suggesting that the downward pressure might be easing. Similarly, the MACD is showing signs of bullish divergence, further supporting the possibility of an upward breakout. If the price manages to break above the bearish trend line, traders could expect a shift towards a bullish phase, potentially targeting higher resistance levels.
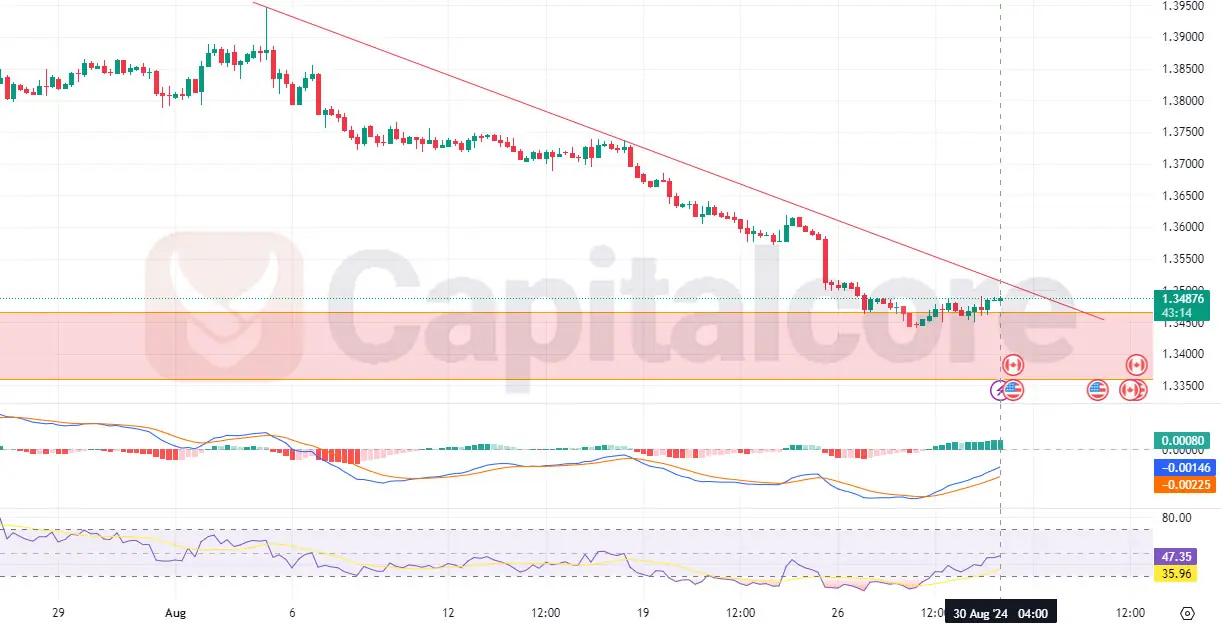
Chart Notes:
• Chart time-zone is UTC (+03:00)
• Candles’ time-frame is 4h.
Fundamentally, today’s economic releases will likely have a significant impact on USD/CAD price action. The Canadian GDP m/m came in slightly below expectations at 0.1%, compared to the forecasted 0.2%, indicating slower economic growth. On the US side, key indicators like the Core PCE Price Index, Personal Income, and Personal Spending were in line with expectations, while the Chicago PMI came in slightly lower than forecasted, reflecting mixed economic signals. The Revised UoM Consumer Sentiment is slightly better than expected, suggesting steady consumer confidence in the US. These mixed economic indicators could lead to a volatile trading environment for USD/CAD, with traders keeping a close watch on the technical breakout signals to navigate their trading strategies effectively.
• DISCLAIMER: Please note that the above analysis is not an investment suggestion by “Capitalcore LLC”. This post has been published only for educational purposes.