Bullish power is reducing
Wholesale Sales and Foreign Securities Purchases data will be released in Canada. On the chart, the price line has formed an ascending channel and right now it is reacting to the area; different indicators are issuing trend reversal signals and bullish market is expected to be ending.
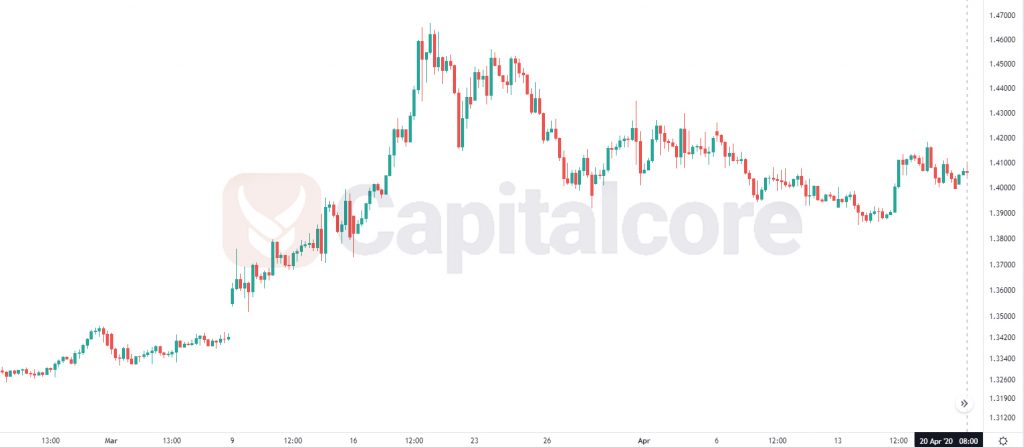
Chart Notes:
• Chart time-zone is UTC (+03:00)
• Candles’ time-frame is 4h.
The pair is finding support at 1.39890 with resistance at 1.41570 which the weekly pivot point at 1.40160 is located in between the lines. The EMA of 10 is moving with bullish bias in the descendant channel and it is located above the EMA of 200 and the EMA of 100. The RSI is rising towards overbought area, the MACD line is below the signal line in the negative territory and the Stochastic is showing upward momentum. The ADX is showing buy signal. The price is above the Ichimoku Cloud and the Chinkou Span. The Tenkan-sen is showing a downward trend while the Kijun-sen is showing a horizontal trend.
The bullish trend is not going to last much. USDCAD will continue its bearish trend towards 1.39230.
• DISCLAIMER: Please note that the above analysis is not an investment suggestion by “Capitalcore Ltd”. This post has been published only for educational purposes.